Fig. 3.
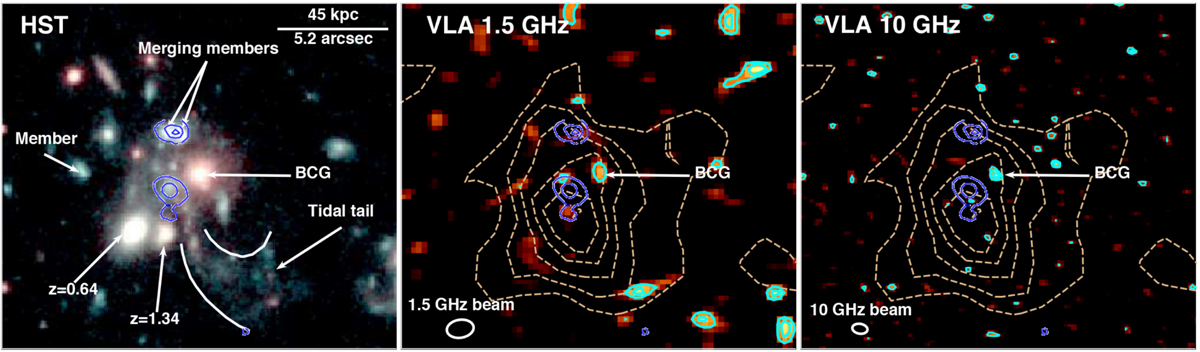
HST (left; RGB image: the F105W filter is in blue and green, F160W in red), VLA 1.5 GHz (center), and VLA 10 GHz (right) images of the BCG and its surroundings taken from Trudeau et al. (2019). North is up, east is left. The CO(4→3) contours are overplotted in blue, as in Fig. 1a. Small shifts of 0.3 and 0.6 arcsec toward the east and north, respectively, are applied to the NOEMA contours, which is consistent with GCS catalog uncertainties in the absolute astrometry used by HST. In the central and right panels, the radio contours (3, 4, and 5σ levels) are in cyan and the Spitzer MIPS 24 μm contours are shown in beige.
Current usage metrics show cumulative count of Article Views (full-text article views including HTML views, PDF and ePub downloads, according to the available data) and Abstracts Views on Vision4Press platform.
Data correspond to usage on the plateform after 2015. The current usage metrics is available 48-96 hours after online publication and is updated daily on week days.
Initial download of the metrics may take a while.