Fig. A.1.
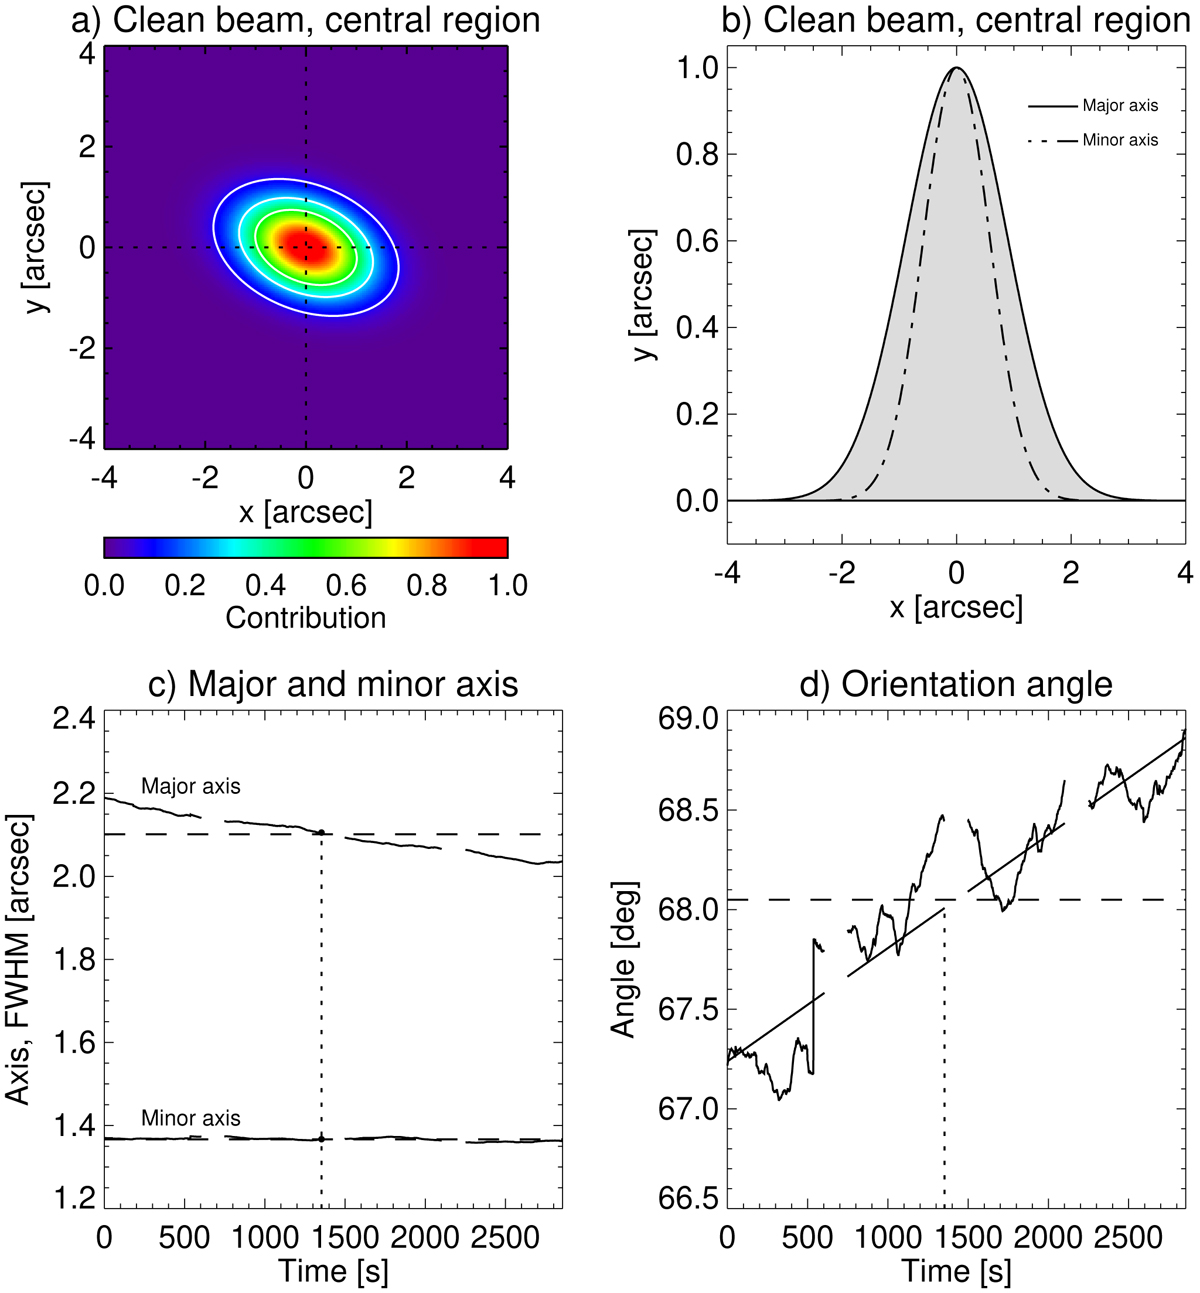
Synthesised beam (here also referred to as point spread function, PSF) representative for the Band 3 solar observations. The beam corresponds to the central frequency of 100 GHz. (a) Coloured contour plot for the central region around the main lobe, (b) profiles along the major and minor axes, (c) variation with time for the major and minor axes, and (d) for the orientation angle. The dashed horizontal lines in the lower panels mark the time-averages of the beam parameters, while the dotted vertical lines mark the time of the actual full-band beam that is closest in size to the representative beam as derived from the time-average of the major and minor axes.
Current usage metrics show cumulative count of Article Views (full-text article views including HTML views, PDF and ePub downloads, according to the available data) and Abstracts Views on Vision4Press platform.
Data correspond to usage on the plateform after 2015. The current usage metrics is available 48-96 hours after online publication and is updated daily on week days.
Initial download of the metrics may take a while.