Fig. 7.
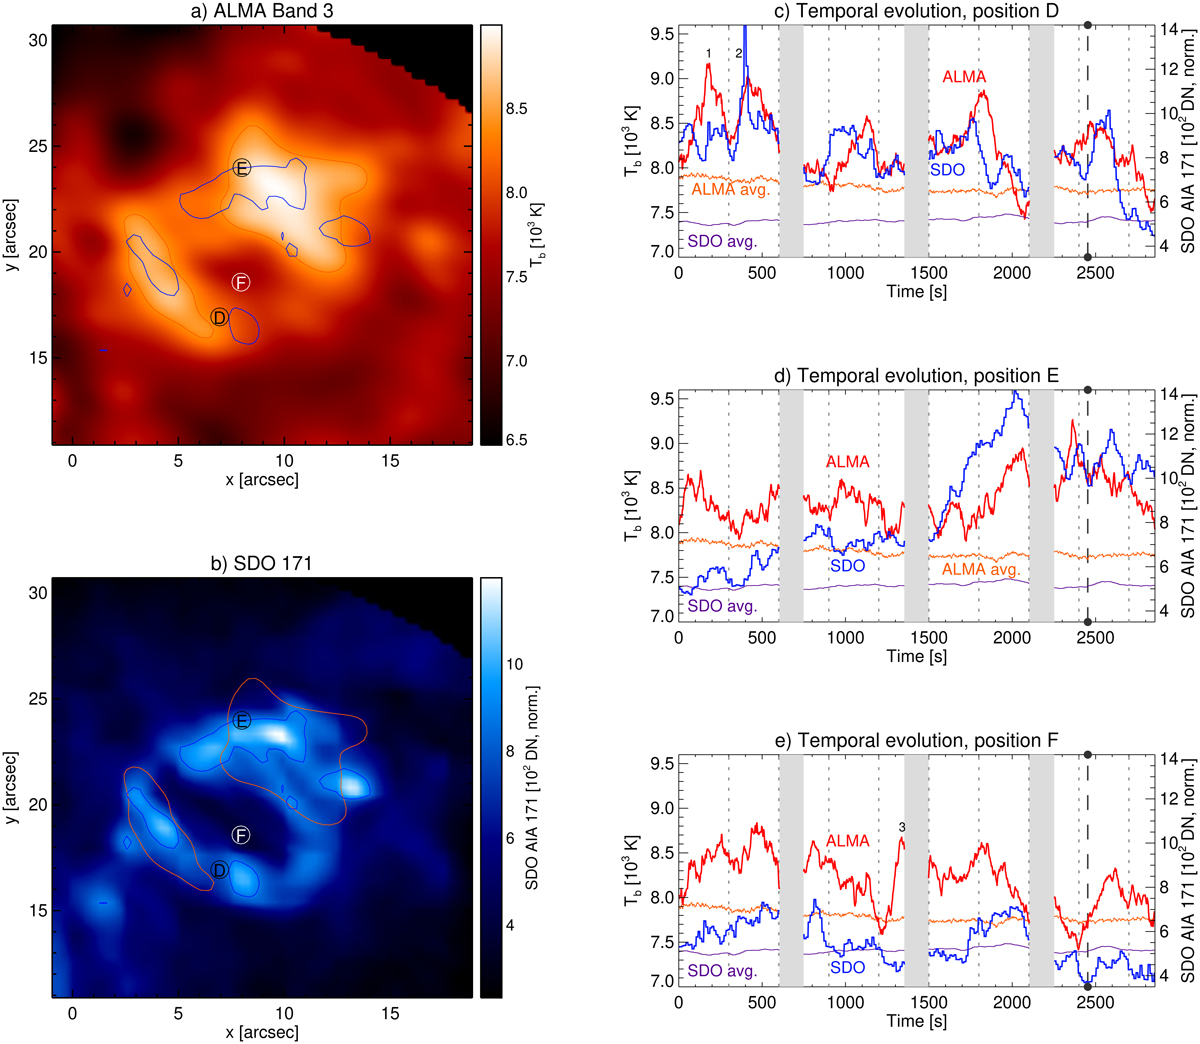
Close-up of a group of compact loops (see red circle in Fig. 3). (a) ALMA Band 3 brightness temperature map with three selected positions (D, E, F). The red contours indicate a brightness temperature of 8400 K, whereas the blue contours enclose SDO AIA171 values of 880 DN. (b) Corresponding SDO AIA171 map with the same contours as in panel a. (c–e) Time evolution for the Band 3 temperatures (thick red lines) and the SDO 171 values (thick blue lines) for the three selected positions (D: black, E: red, F: blue). Three events showing a temperature increase are labelled 1–3. For comparison, the average over all pixels contained in the close-up region are shown as orange lines for ALMA and purple lines for SDO 171. The calibration breaks with no science data are shown as grey shaded areas. The SDO data used here are integration-time-corrected level 1 data numbers (DN) on a linear scale.
Current usage metrics show cumulative count of Article Views (full-text article views including HTML views, PDF and ePub downloads, according to the available data) and Abstracts Views on Vision4Press platform.
Data correspond to usage on the plateform after 2015. The current usage metrics is available 48-96 hours after online publication and is updated daily on week days.
Initial download of the metrics may take a while.