Fig. 6.
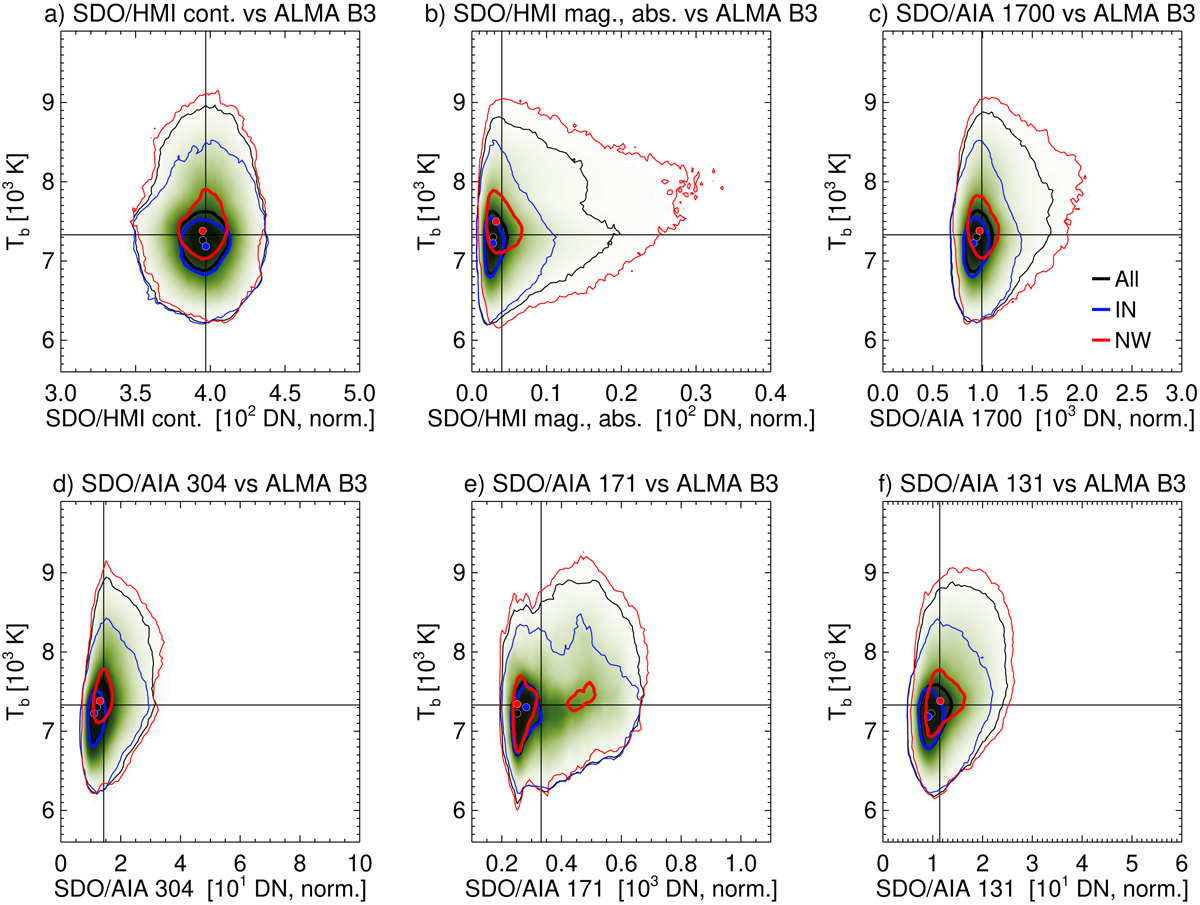
Correlation of ALMA Band 3 (full-band) with selected SDO channels: (a) HMI continuum, (b) HMI magnetogram, (c) AIA 1700, (d) AIA 304, (e) AIA 171, and (f) AIA 131. All pixels in the inner region of the FOV (excluding the region with the compact loops) for the whole observing period are considered. All SDO maps are convolved with the representative ALMA Band 3 beam. The two-dimensional histograms in each panel are shown in green for all pixels and also with contour levels for all pixels (black), internetwork (blue), and network (red). Thick contours mark levels of 0.5 and thin contours level of 0.01 with respect to the maximum histogram value. The coloured dots show the corresponding maxima. The straight black lines represent the median value for ALMA Band 3 (all pixels) and for the selected SDO channel. We note that the SDO data used here are integration-time-corrected level 1 data numbers (DN) on a linear scale.
Current usage metrics show cumulative count of Article Views (full-text article views including HTML views, PDF and ePub downloads, according to the available data) and Abstracts Views on Vision4Press platform.
Data correspond to usage on the plateform after 2015. The current usage metrics is available 48-96 hours after online publication and is updated daily on week days.
Initial download of the metrics may take a while.