Fig. 5.
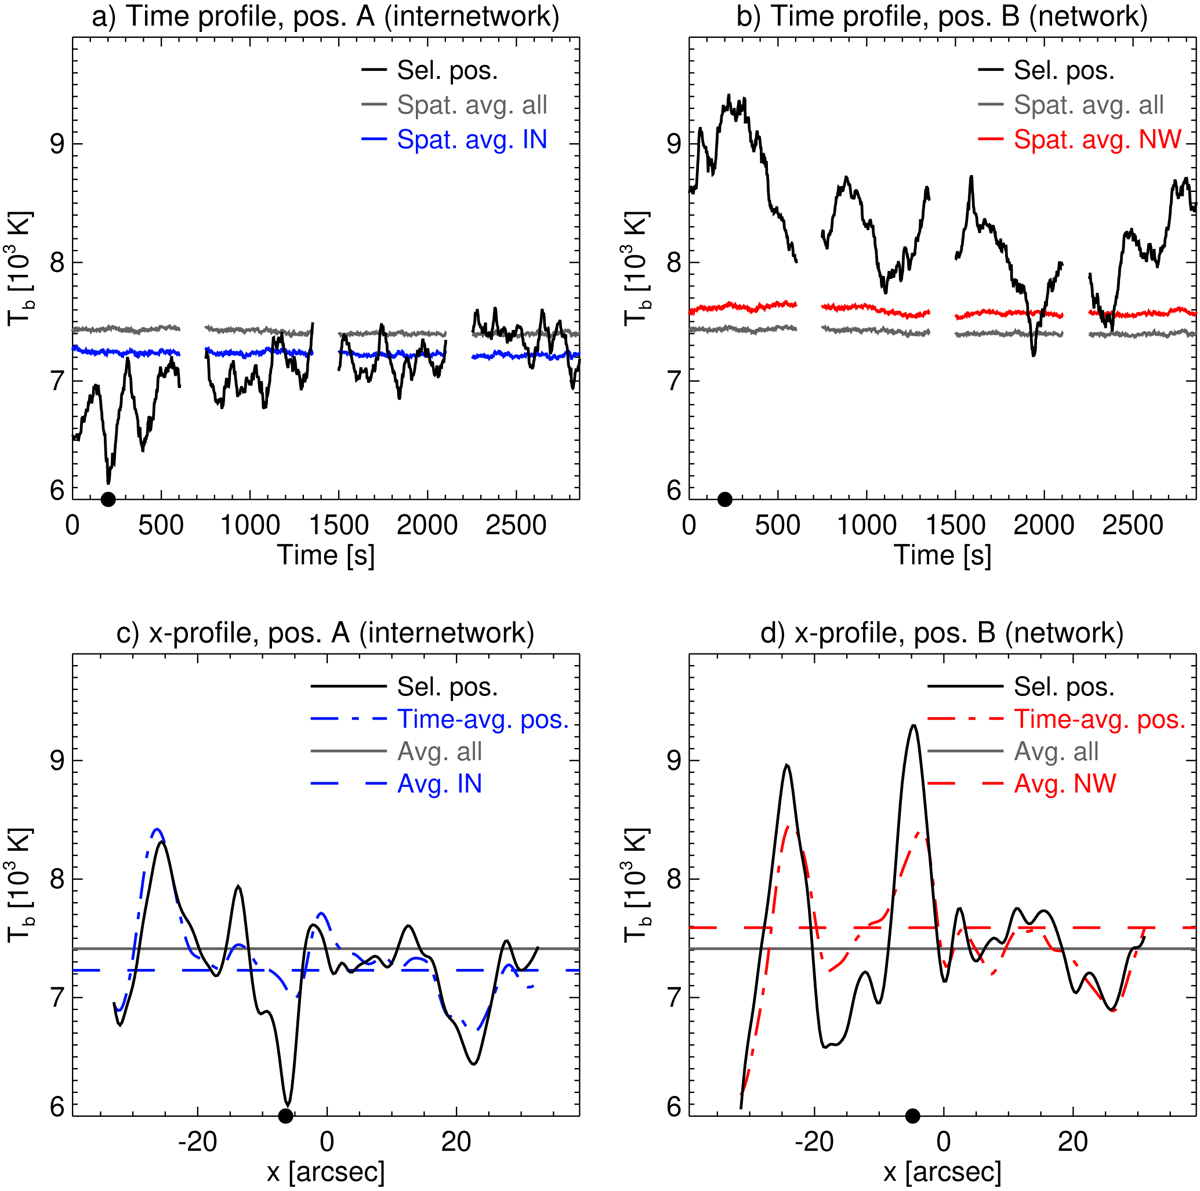
ALMA brightness temperatures for the two selected positions A (internetwork) and B (network) indicated in Fig. 4. Upper row: temporal evolution for (a) the internetwork position A and (b) the network position B. The dot on the abscissa marks the time step shown in Fig. 3. The temporal evolution of the average over all pixels in the inner region (radius r ≤ 22″, grey line) and over the contained internetwork (IN, blue line) and network (NW, red line) pixels is plotted for comparison. Profiles along the x-axis are shown in the lower row for the same time step for (c) position A (internetwork) and (d) position B (network). The selected spatial position in Fig. 4a is indicated by a dot on the abscissa. For comparison, the time-averages at the selected positions (blue and red dot-dashed lines), the averages over all time steps for all pixels in the inner region (grey solid line) and for the internetwork and network pixels (blue and red dashed lines), respectively, are shown.
Current usage metrics show cumulative count of Article Views (full-text article views including HTML views, PDF and ePub downloads, according to the available data) and Abstracts Views on Vision4Press platform.
Data correspond to usage on the plateform after 2015. The current usage metrics is available 48-96 hours after online publication and is updated daily on week days.
Initial download of the metrics may take a while.