Fig. 4.
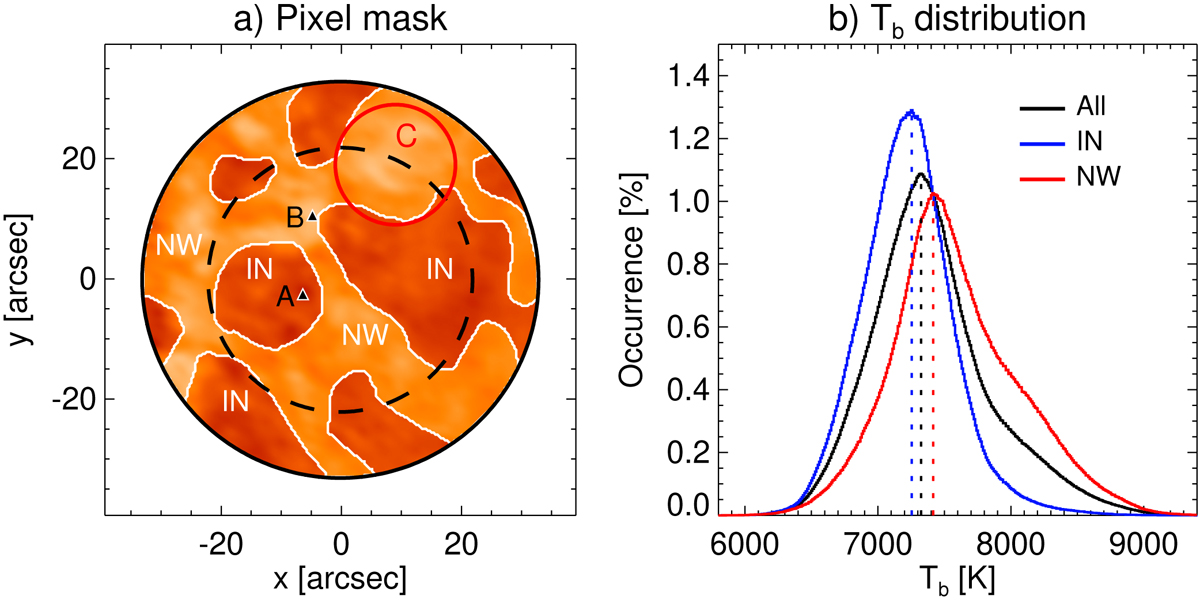
(a) Pixel mask distinguishing between network (NW) and internetwork (IN) pixels (white lines separate NW and IN). The black dashed circle shows the inner region with a radius of 22″. The red circle shows the location of a group of compact loops (labelled C). The triangles show two locations (A and B) for which profiles are shown in Fig. 5. (b) Brightness temperature distributions in the inner regions of the FOV (radius r ≤ 22″) over the whole observing time period. All pixels (black) compared to internetwork (blue) and network pixels (red) for the full band maps.
Current usage metrics show cumulative count of Article Views (full-text article views including HTML views, PDF and ePub downloads, according to the available data) and Abstracts Views on Vision4Press platform.
Data correspond to usage on the plateform after 2015. The current usage metrics is available 48-96 hours after online publication and is updated daily on week days.
Initial download of the metrics may take a while.