Fig. 3.
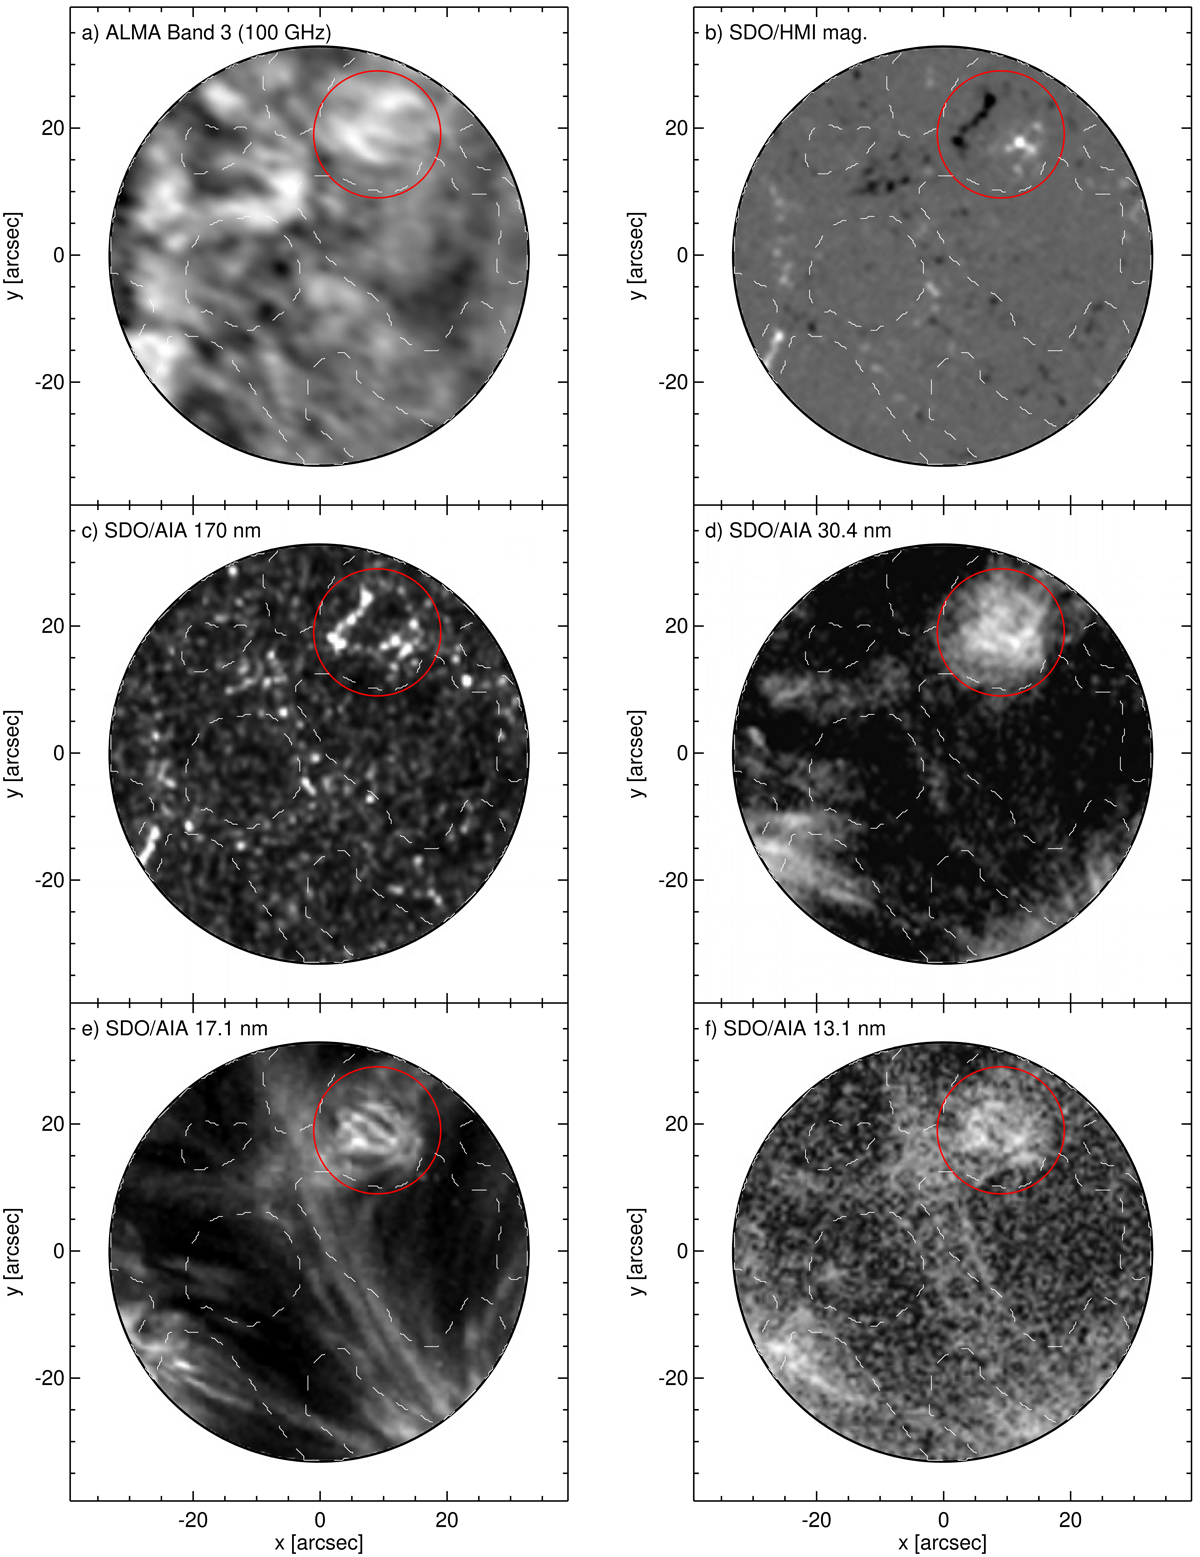
(a) Representative ALMA Band 3 image at 2016-12-22 14:22:52 UT in comparison to co-aligned SDO maps: (b) SDO/HMI magnetogram, (c) SDO/AIA 170 nm, (d) SDO/AIA 30.4 nm, (e) SDO/AIA 17.1 nm, (f) SDO/AIA 13.1 nm. The SDO data are post-processed (level 2) and re-scaled in order to increase the visibility of the atmospheric structure. The network–internetwork mask is overplotted with dashed contours. The red circle marks a region with a compact group of magnetic loops.
Current usage metrics show cumulative count of Article Views (full-text article views including HTML views, PDF and ePub downloads, according to the available data) and Abstracts Views on Vision4Press platform.
Data correspond to usage on the plateform after 2015. The current usage metrics is available 48-96 hours after online publication and is updated daily on week days.
Initial download of the metrics may take a while.