Fig. 2.
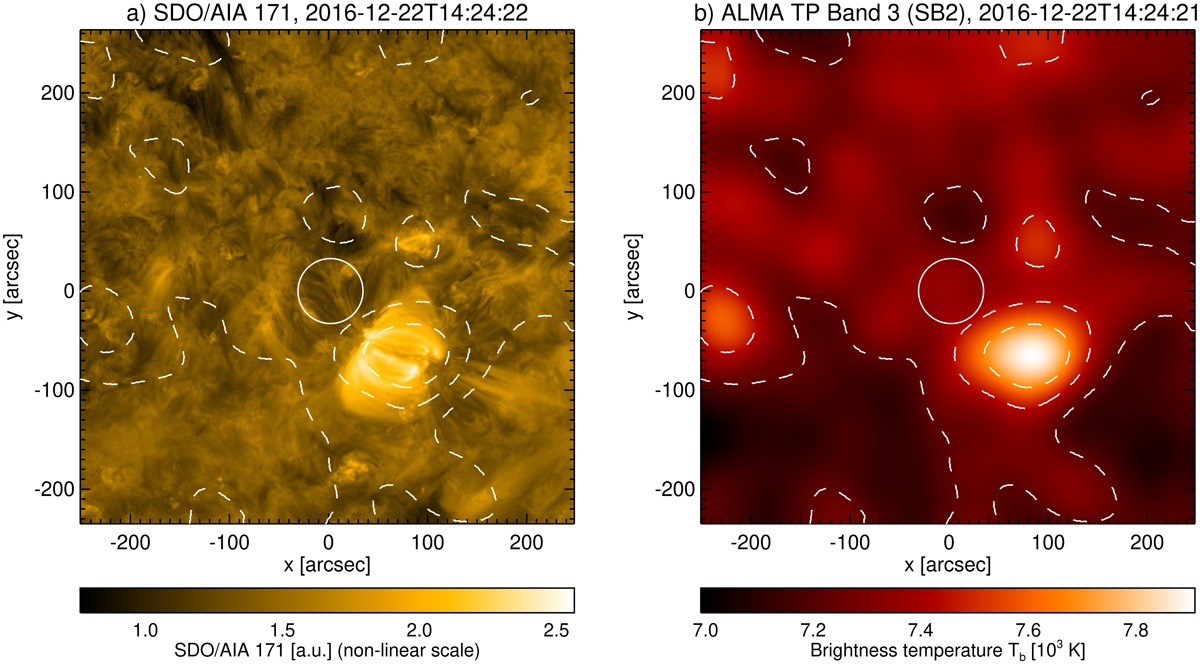
Context maps for the surroundings of the interferometric field of view (white circle). (a) SDO/AIA 17.1 nm. The SDO data are post-processed (level 2) in order to increase the visibility of the atmospheric structure. (b) ALMA TP Band 3 (sub-band 2). The white dashed lines are contours for the ALMA data. The displayed data range for the SDO map is limited to 20% of the maximum in order to make dimmer structures more visible. The beam size of the ALMA map is comparable to the shown interferometric FOV.
Current usage metrics show cumulative count of Article Views (full-text article views including HTML views, PDF and ePub downloads, according to the available data) and Abstracts Views on Vision4Press platform.
Data correspond to usage on the plateform after 2015. The current usage metrics is available 48-96 hours after online publication and is updated daily on week days.
Initial download of the metrics may take a while.