Free Access
Fig. 13.
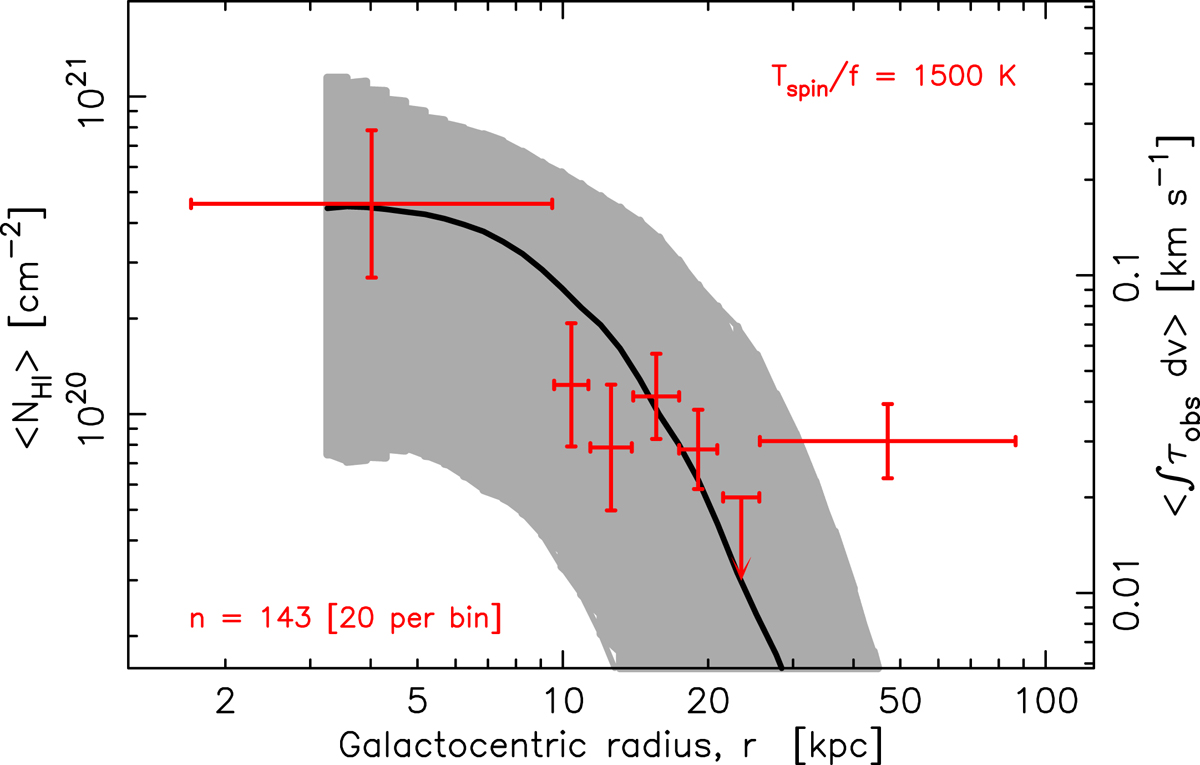
Mean H I column density from an ensemble of z = 0 galaxies from the TNG (left axis), with the integrated column density of the 21-cm absorption overlain (for Tspin/f = 1500 K, right axis). The shaded region shows the 16th and 84th percentiles (1σ) of the population variation in the TNG.
Current usage metrics show cumulative count of Article Views (full-text article views including HTML views, PDF and ePub downloads, according to the available data) and Abstracts Views on Vision4Press platform.
Data correspond to usage on the plateform after 2015. The current usage metrics is available 48-96 hours after online publication and is updated daily on week days.
Initial download of the metrics may take a while.