Fig. 1.
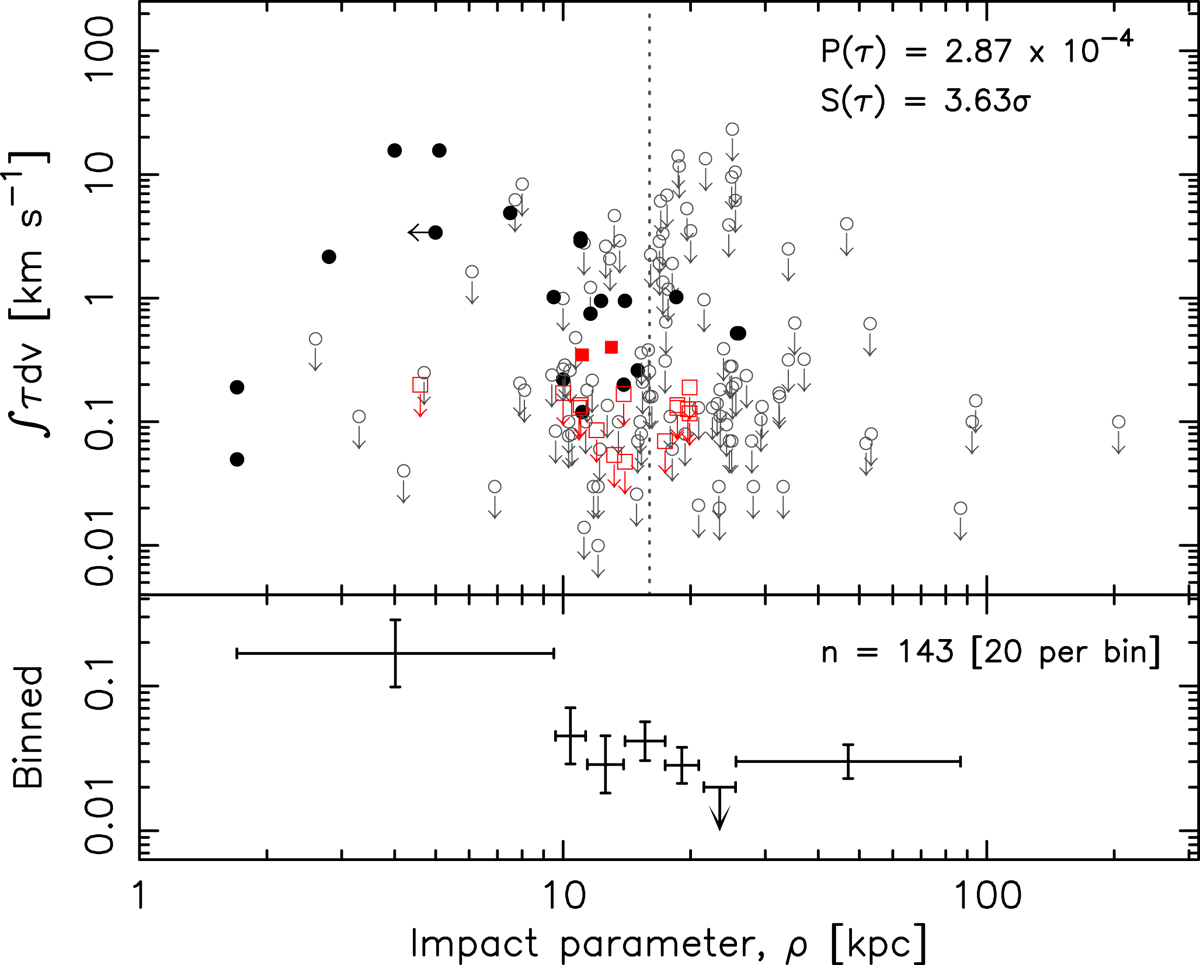
Velocity integrated optical depth versus the impact parameter for all of the published searches. The circles represent the previous data (Curran et al. 2016 and references therein) and the squares the data since (Borthakur 2016; Dutta et al. 2017; Allison et al. 2020). The downward arrows signify the 3σ upper limits and the dotted vertical line shows the median impact parameter. Bottom panel: binned values, including the limits via the Kaplan–Meier estimator, in equally sized bins. The horizontal error bars show the range of points in the bin and the vertical error bars the 1σ uncertainty in the mean value.
Current usage metrics show cumulative count of Article Views (full-text article views including HTML views, PDF and ePub downloads, according to the available data) and Abstracts Views on Vision4Press platform.
Data correspond to usage on the plateform after 2015. The current usage metrics is available 48-96 hours after online publication and is updated daily on week days.
Initial download of the metrics may take a while.