Free Access
Fig. 7
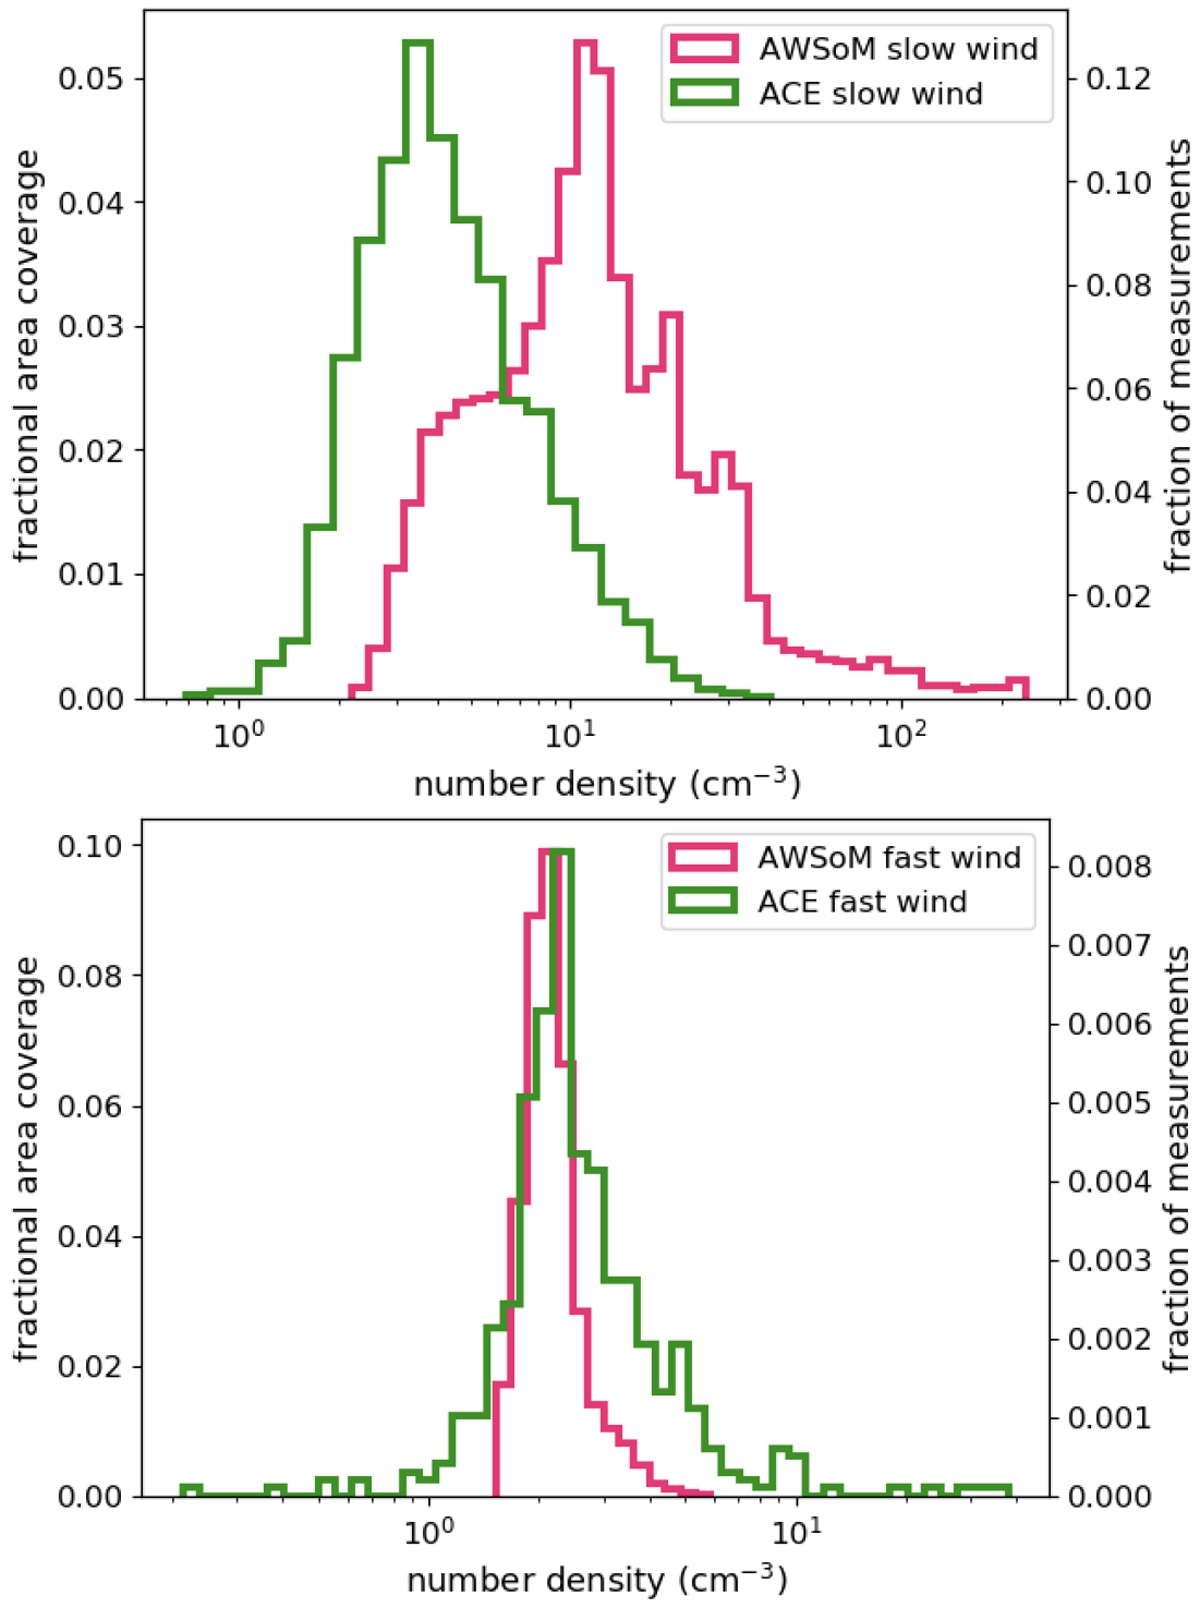
Simulated and observed proton number densities for both slow (top) and fast (bottom) component of the wind at 1 AU. The left y-axis represents fractional area coverage of our AWSoM simulations and the right y-axis represents the fraction of ACE measurements.
Current usage metrics show cumulative count of Article Views (full-text article views including HTML views, PDF and ePub downloads, according to the available data) and Abstracts Views on Vision4Press platform.
Data correspond to usage on the plateform after 2015. The current usage metrics is available 48-96 hours after online publication and is updated daily on week days.
Initial download of the metrics may take a while.