Free Access
Fig. D.1
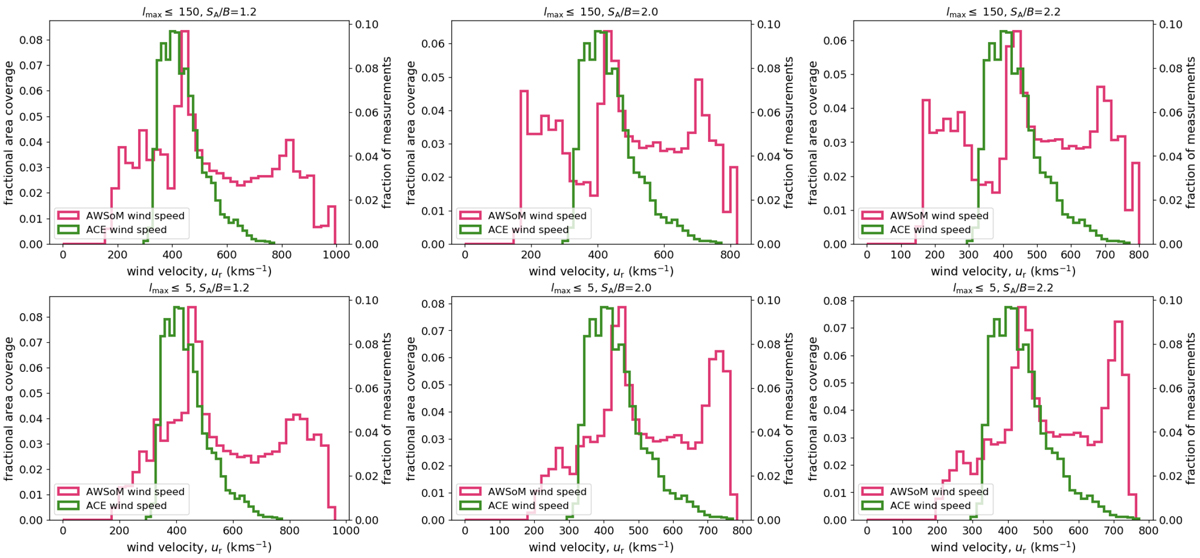
Distribution of wind velocity at 1 AU for a subset of our simulations during solar cycle minimum and maximum. Each column represents a steady state simulation for different values of SA ∕B. The resolution of the magnetogram is truncated to lmax = 150 (top) and lmax = 5 (bottom). ACE data is shown in green.
Current usage metrics show cumulative count of Article Views (full-text article views including HTML views, PDF and ePub downloads, according to the available data) and Abstracts Views on Vision4Press platform.
Data correspond to usage on the plateform after 2015. The current usage metrics is available 48-96 hours after online publication and is updated daily on week days.
Initial download of the metrics may take a while.