Fig. 6.
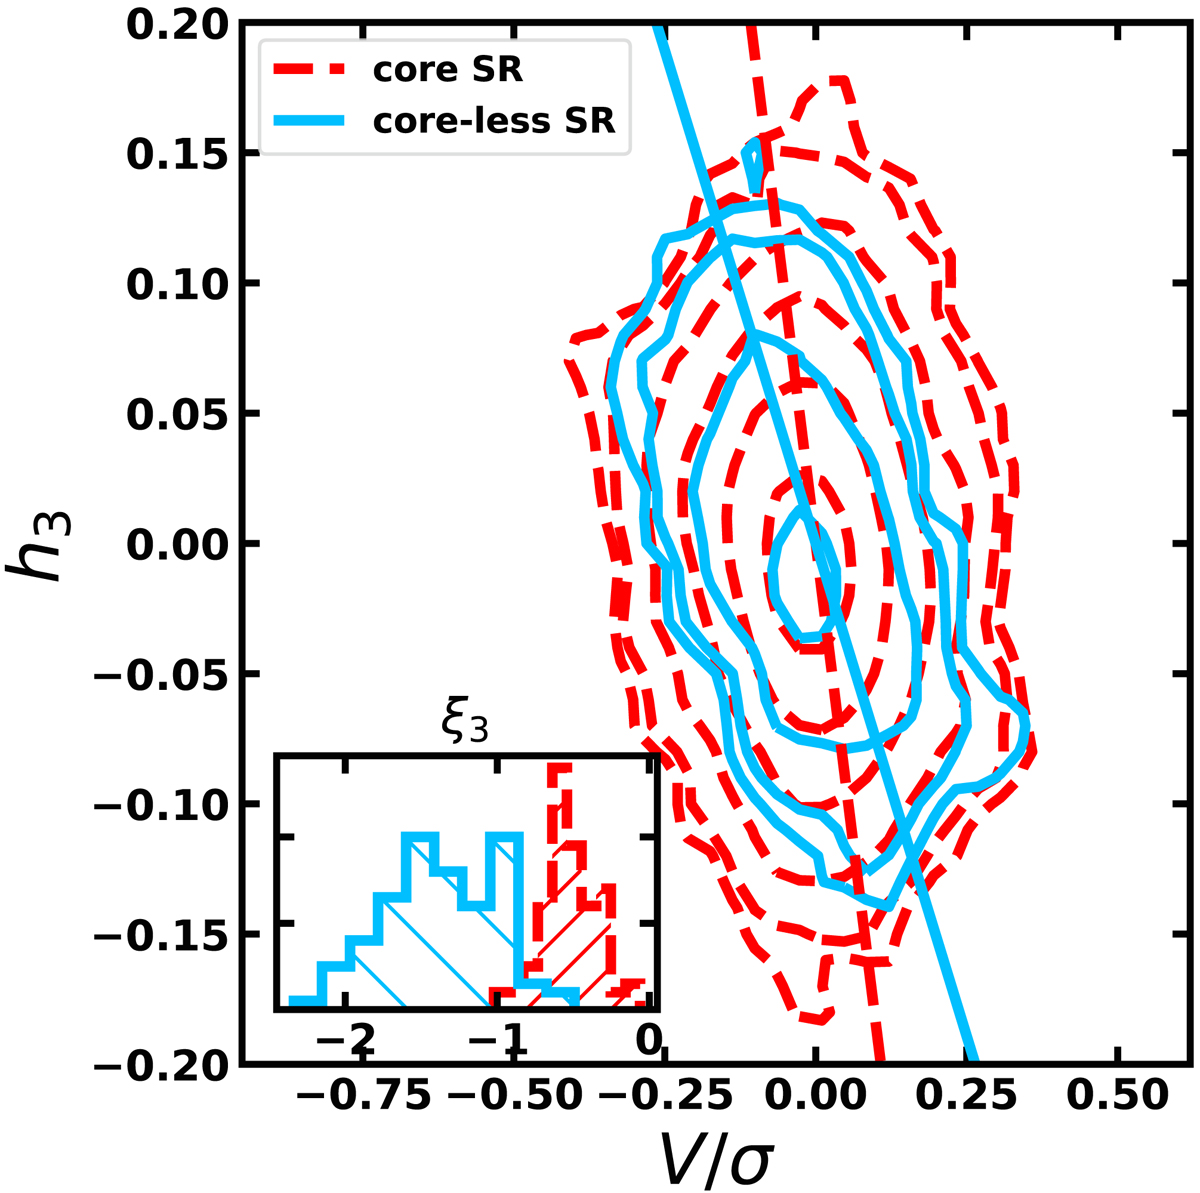
Local V/σ − h3 diagram for slow rotators separated into core (dashed red line) and core-less (solid blue line). Contours are based on logarithmic number counts starting from 0.25 and 0.5 and then increase with a step of 0.5 until 2.5 for core slow rotators and 1.5 for core-less slow rotators, respectively. Only bins with an uncertainty δh3 < 0.05 and σe > 120 km s−1 are plotted. Straight lines show the slope of the distributions as measured by the ξ3 parameter (see text for details). The inset histogram shows the distribution of the ξ3 obtained using the jackknife method, where from the original distributions for core slow rotators and core-less slow rotators one galaxy (in each sub-sample) was randomly removed, and the ξ3 remeasured. The histograms are notably different, with core-less slow rotators having steeper slopes (ξ3 < 1). This confirms the robustness of the weak anti-correlation between the V/σ and h3 distributions of core-less slow rotators.
Current usage metrics show cumulative count of Article Views (full-text article views including HTML views, PDF and ePub downloads, according to the available data) and Abstracts Views on Vision4Press platform.
Data correspond to usage on the plateform after 2015. The current usage metrics is available 48-96 hours after online publication and is updated daily on week days.
Initial download of the metrics may take a while.