Fig. 3.
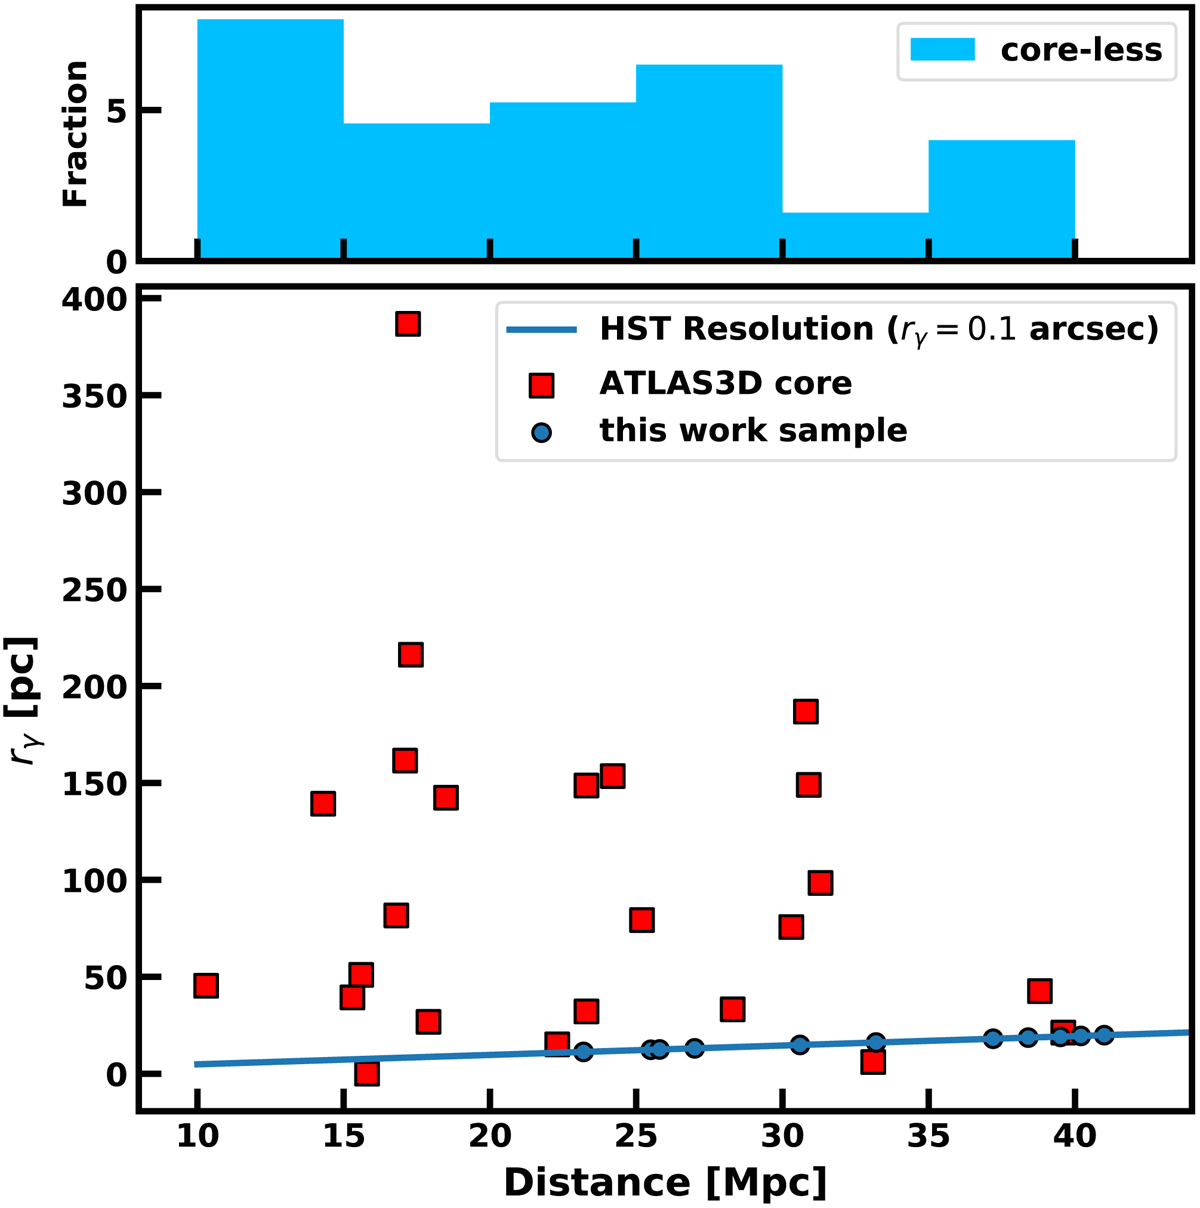
Distribution of sizes (rγ) and distances to core ATLAS3D galaxies (red squares). The blue solid line shows the HST limit of rγ < 0.1″, assumed for all galaxies that have γ′ > 0.5. Below this line, cores cannot formally be detected. Circles on the line are the upper limits on possible core sizes for galaxies presented here with values from Table 2. The histogram at the top shows the fraction of core-less galaxies in bins of distance. There is no evidence for an increase of the fraction of core-less galaxies as a result of resolution effects.
Current usage metrics show cumulative count of Article Views (full-text article views including HTML views, PDF and ePub downloads, according to the available data) and Abstracts Views on Vision4Press platform.
Data correspond to usage on the plateform after 2015. The current usage metrics is available 48-96 hours after online publication and is updated daily on week days.
Initial download of the metrics may take a while.