Fig. 1.
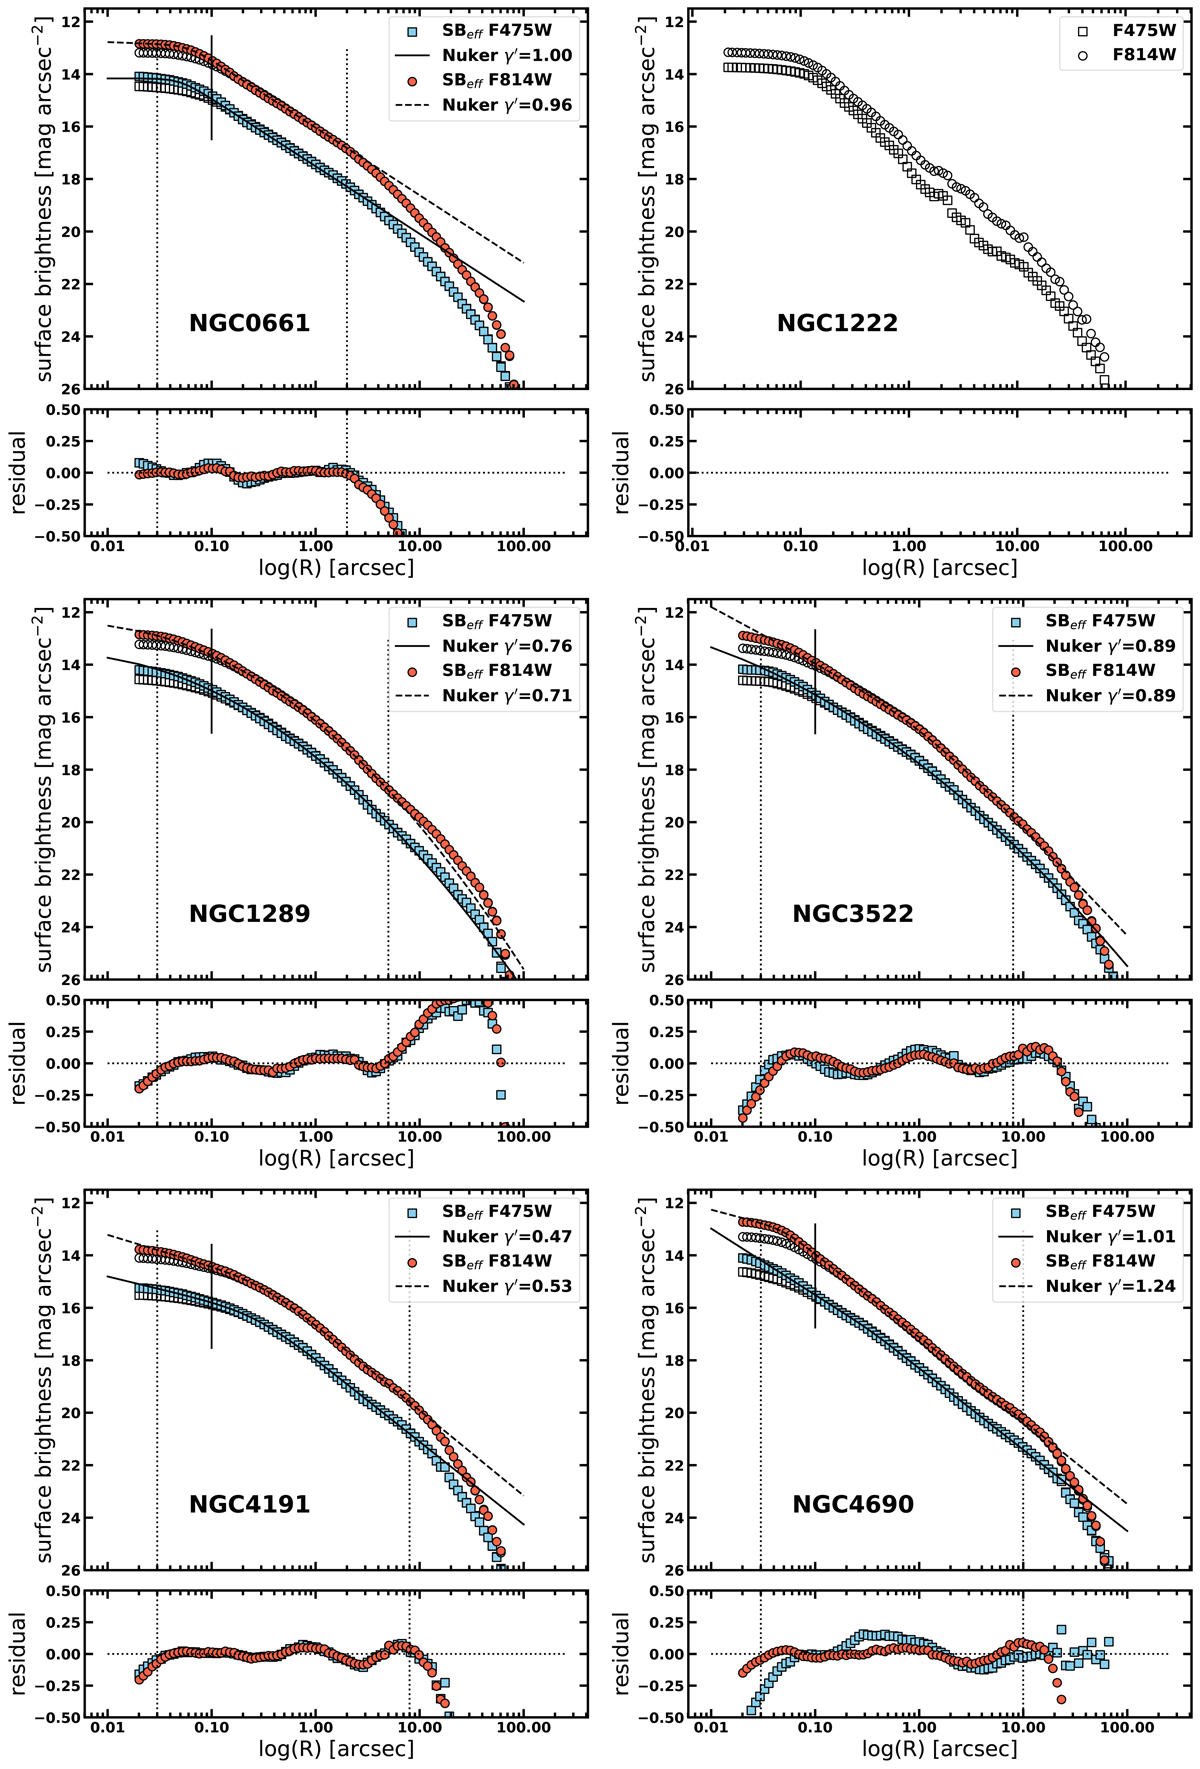
Surface brightness profiles of the first six low-mass slow rotators from the ATLAS3D survey (ordered by name). Each galaxy is represented by two panels. The upper panel shows light profiles in F475W (light blue squares) and F814W (red circles) filters, and the smaller lower panel shows residuals from the fit. Open symbols are original (observed) light profiles, and filled symbols are effective (deconvolved) profiles used for the analysis. The sampling does not correspond to the pixels of the WFC3 camera, but it is defined by the tool for the isophote analysis. The Nuker fits to both filters are shown with solid (F475W) and dashed (F814W) lines. Two vertical dotted lines indicate the range used in the fit. The short vertical solid line indicates the location at which the γ′ slope is measured. Our images have a pixel scale of ![]() . For a comparison with Richardson-Lucy deconvolution results, see Appendix A.
. For a comparison with Richardson-Lucy deconvolution results, see Appendix A.
Current usage metrics show cumulative count of Article Views (full-text article views including HTML views, PDF and ePub downloads, according to the available data) and Abstracts Views on Vision4Press platform.
Data correspond to usage on the plateform after 2015. The current usage metrics is available 48-96 hours after online publication and is updated daily on week days.
Initial download of the metrics may take a while.