Free Access
Fig. 9
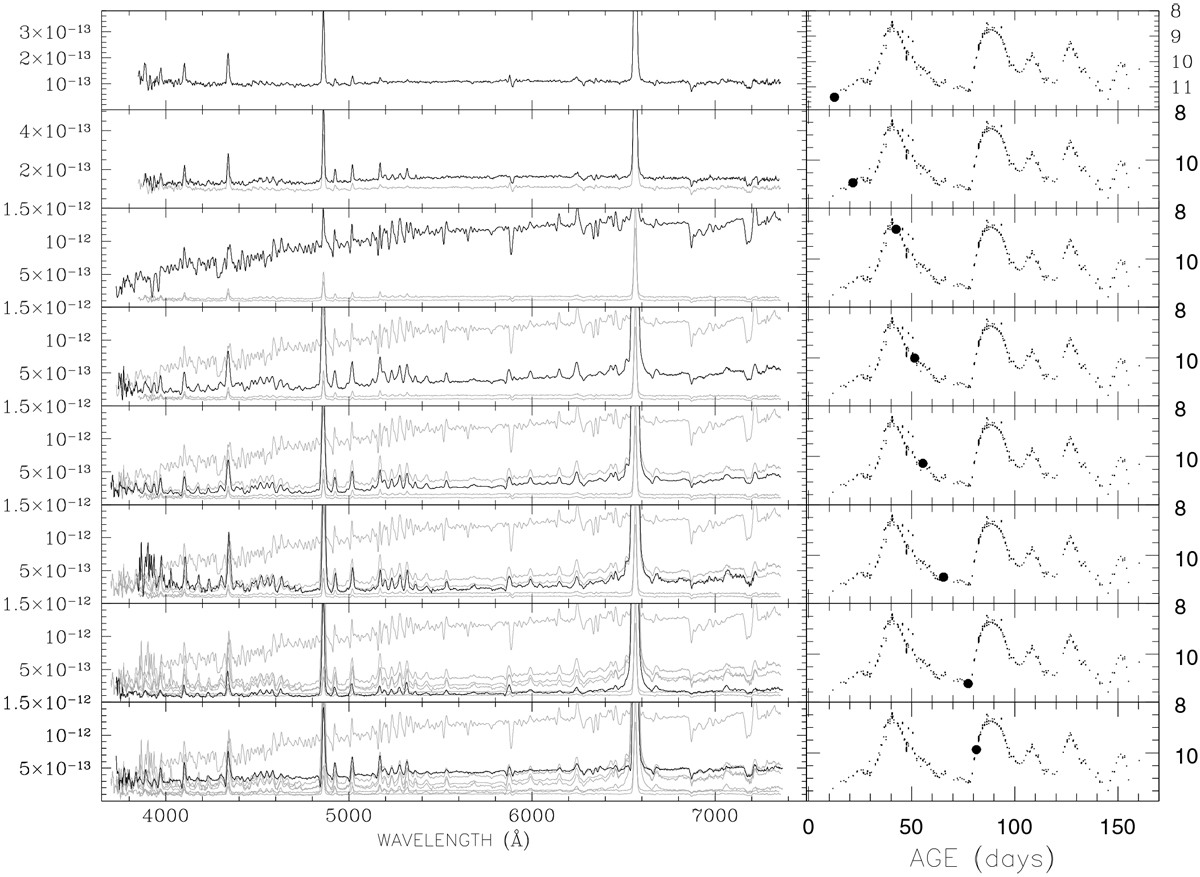
Sequence of low-resolution flux calibrated ARAS spectra, together with their position in the V -band light curve. The Y -axis units are in erg cm−2 s−1 Å−1 and mag on the left and right side, respectively. Each panel plots in gray the previous spectra for easier comparison.
Current usage metrics show cumulative count of Article Views (full-text article views including HTML views, PDF and ePub downloads, according to the available data) and Abstracts Views on Vision4Press platform.
Data correspond to usage on the plateform after 2015. The current usage metrics is available 48-96 hours after online publication and is updated daily on week days.
Initial download of the metrics may take a while.