Fig. 8
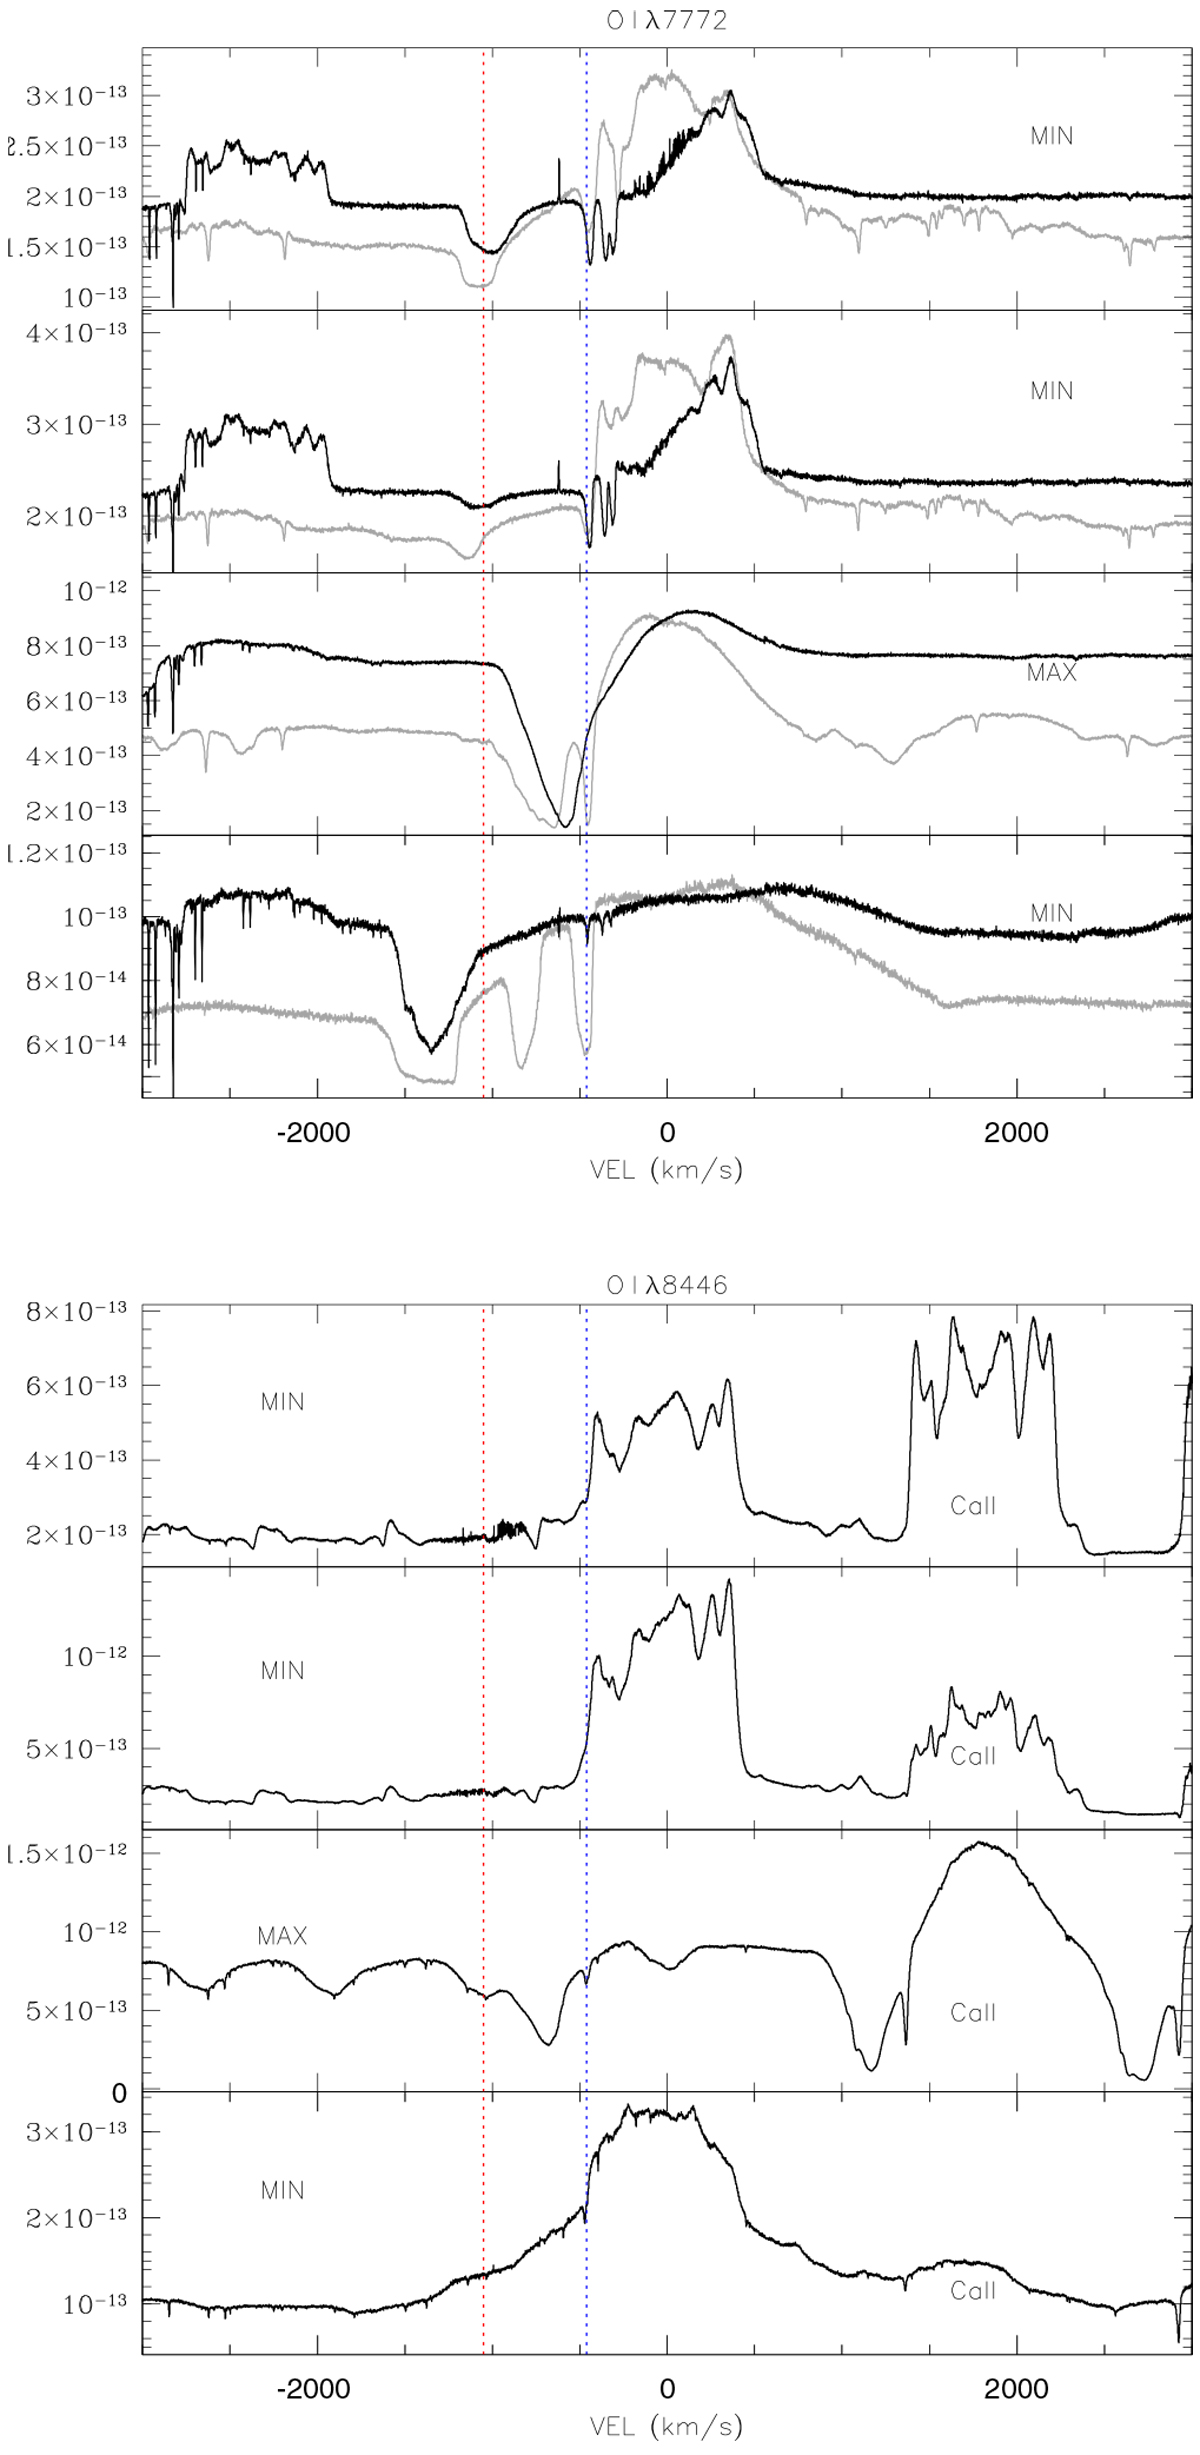
Evolution of the O I triplets (RMT 1, top, and 4, bottom). Triplet (1) is resolved in the narrow absorption at approximately −460 km s−1. Together with triplet (1) we overplot the Hδ profile forcomparison (gray line) (see text for details; the H line has been arbitrarily offset in each subpanel; in the bottom subpanel it has also been scaled by a factor 0.5). The blue line of the Ca II triplet is included in the bottom panel; it shows similar behavior to the O I RMT 4. The Y -axis units are in erg cm−2 s−1 Å−1. The colored vertical dotted lines have the usual meaning. The photometric state (min, max) of each spectrum is indicated in each subpanel.
Current usage metrics show cumulative count of Article Views (full-text article views including HTML views, PDF and ePub downloads, according to the available data) and Abstracts Views on Vision4Press platform.
Data correspond to usage on the plateform after 2015. The current usage metrics is available 48-96 hours after online publication and is updated daily on week days.
Initial download of the metrics may take a while.