Fig. 5
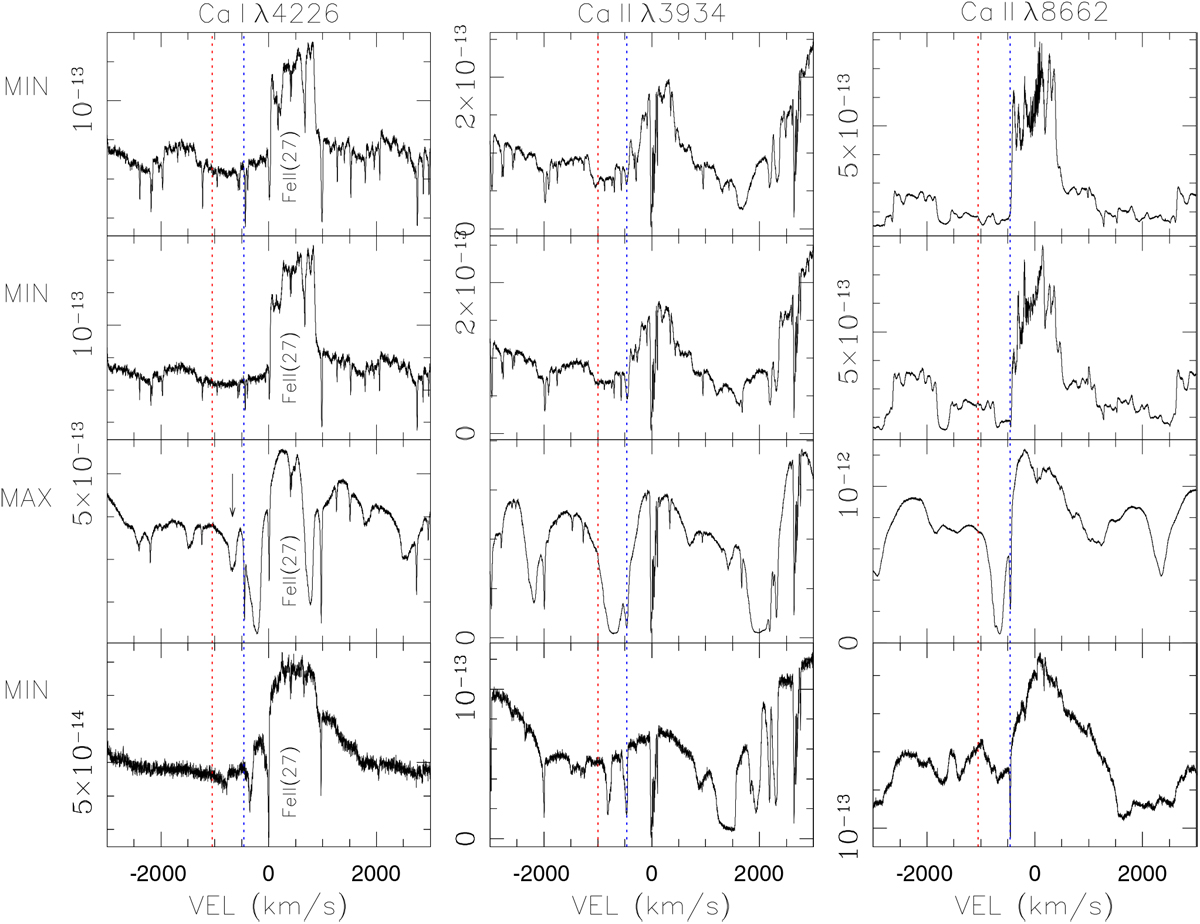
Evolution of the Ca I and Ca II line profiles (see text for details). The emission centered at about +500 km s−1 in the first column (Ca I panels) is from Fe II RMT 27. The arrow in the third panel from the top indicates the second broad absorption from Ca I λ4226. The Y -axis units are in erg cm−2 s−1 Å−1. The blue and red dotted lines indicate the velocity of the persistent narrow absorption (see Sect. 4.1) and of the He I absorption in the first UVES spectrum, respectively. The photometric state (min, max) of the spectra is indicated on the left of each row.
Current usage metrics show cumulative count of Article Views (full-text article views including HTML views, PDF and ePub downloads, according to the available data) and Abstracts Views on Vision4Press platform.
Data correspond to usage on the plateform after 2015. The current usage metrics is available 48-96 hours after online publication and is updated daily on week days.
Initial download of the metrics may take a while.