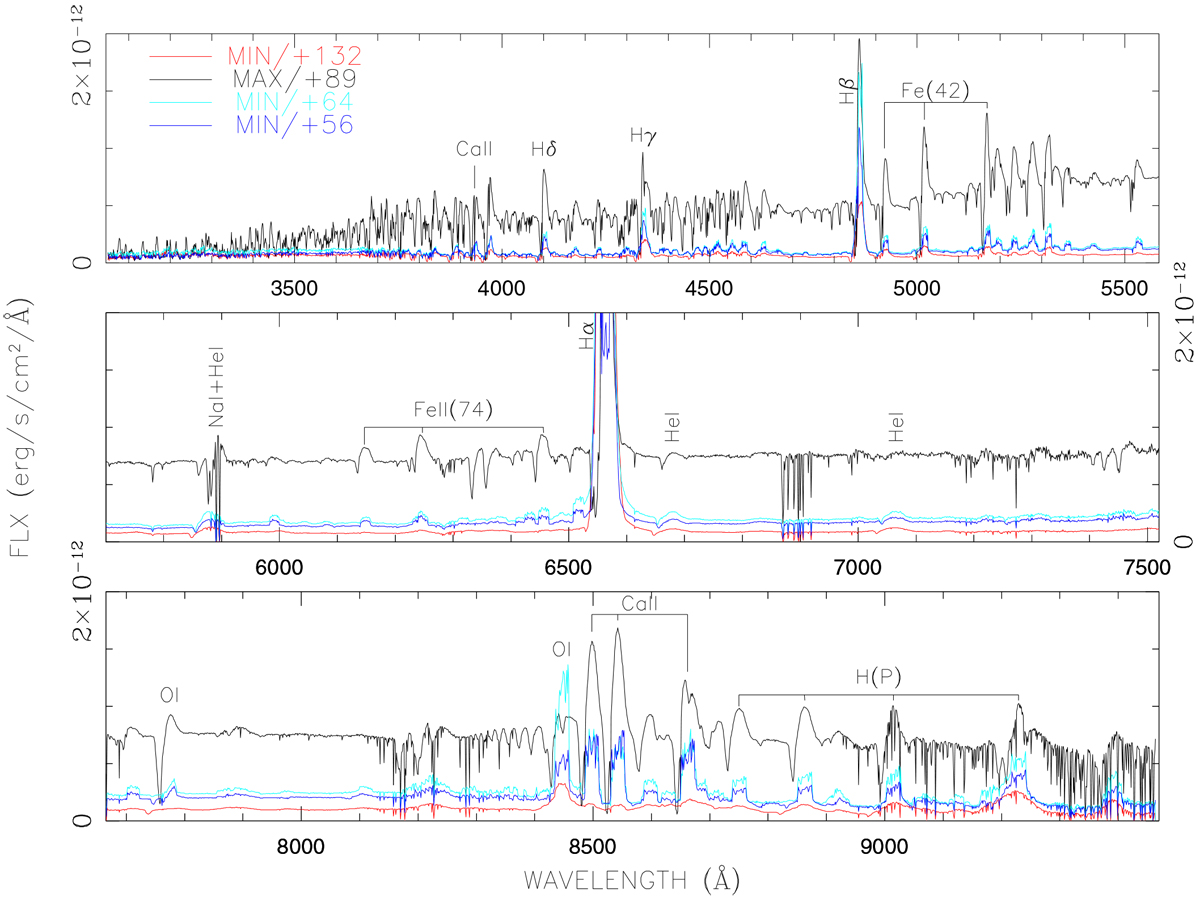
Fig. 3

Four high-resolution spectra taken at VLT/UVES. The spectra have been split in three panels where there is the wavelength gap induced by the dichroic or the detector mosaic (red arm only). Photometric state and age since discovery (in days) are color-coded in the upper panel. The Hα line is saturated in all UVES spectra. The spectra in the figure have not been corrected for reddening.
Current usage metrics show cumulative count of Article Views (full-text article views including HTML views, PDF and ePub downloads, according to the available data) and Abstracts Views on Vision4Press platform.
Data correspond to usage on the plateform after 2015. The current usage metrics is available 48-96 hours after online publication and is updated daily on week days.
Initial download of the metrics may take a while.


