Fig. 6
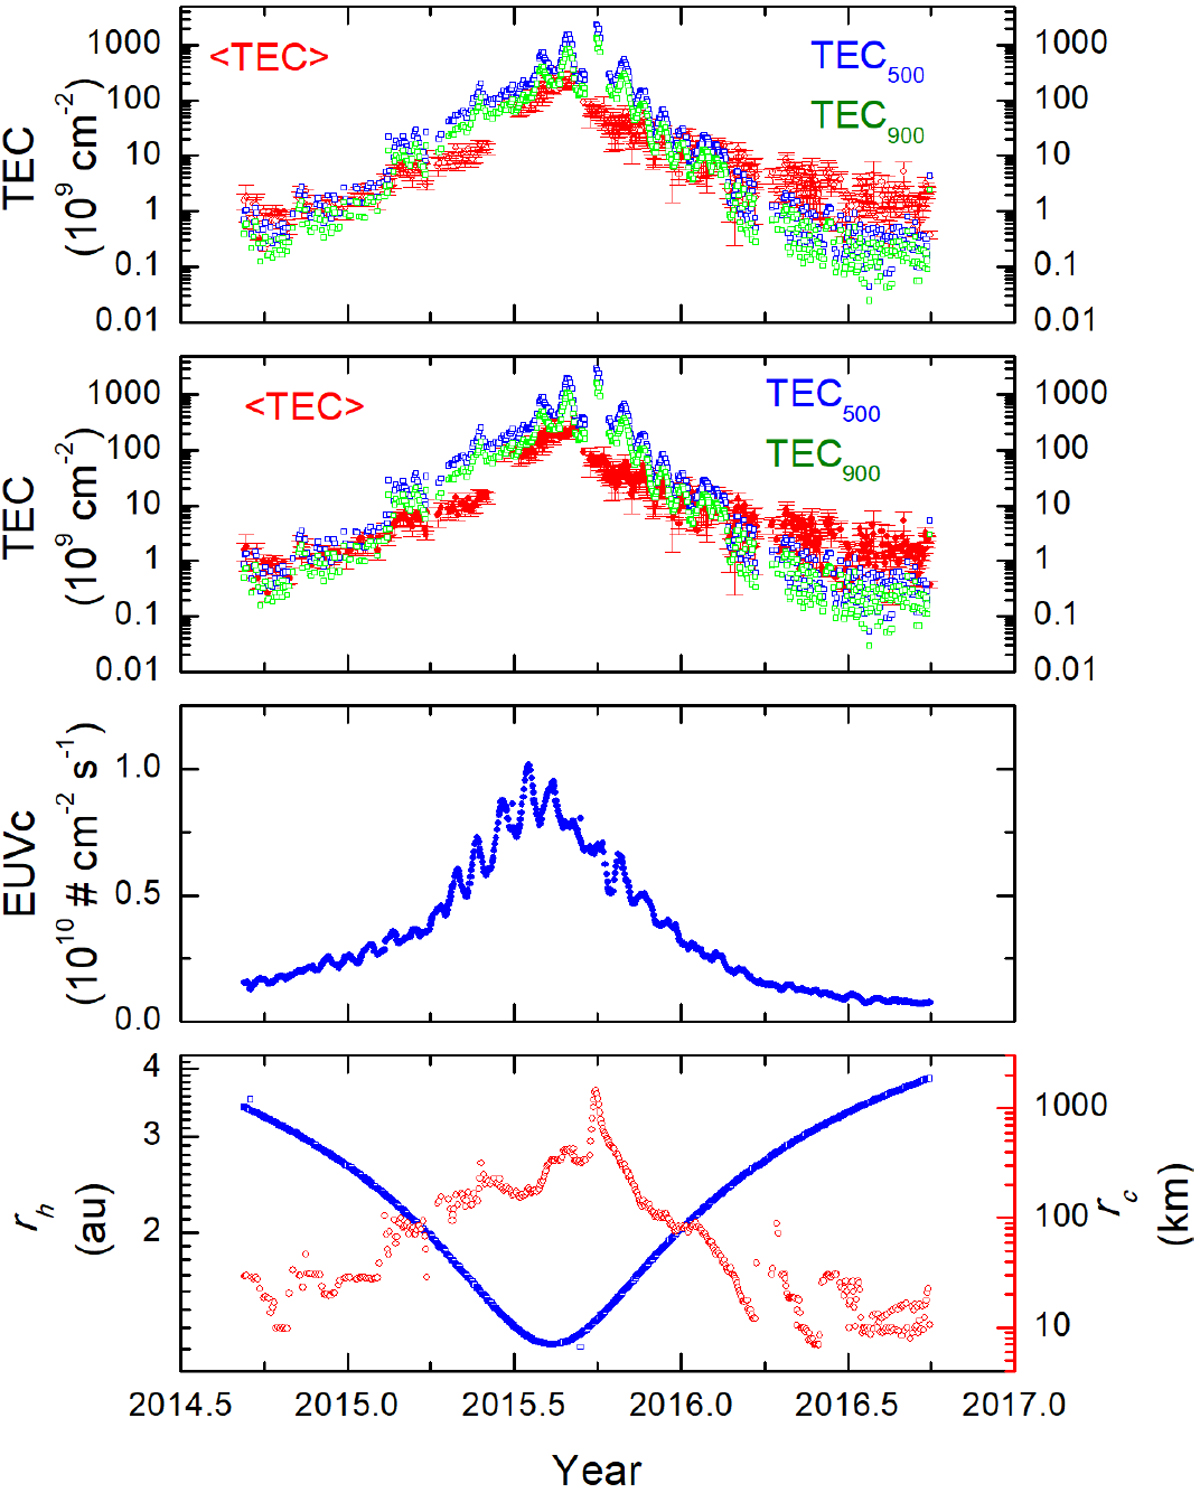
Comparison between observed and modeled TEC at comet 67P during the entire Rosetta mission operation period. In the top two panels, the red points show the diurnally averaged TEC values obtained from actual observation,while the blue and green points correspond to the model TEC values for ion bulk speeds of 500 and 900 m s−1, respectively. Top panel: the modeled TEC values correspond to a pure H2O coma, while they correspond to a pure CO2 coma in thesecond panel from the top. Third panel from the top: corrected EUV fluxes incident on the comet. Bottom panel: variations of rh (blue, legend on the left) and rc (red, legend on the right).
Current usage metrics show cumulative count of Article Views (full-text article views including HTML views, PDF and ePub downloads, according to the available data) and Abstracts Views on Vision4Press platform.
Data correspond to usage on the plateform after 2015. The current usage metrics is available 48-96 hours after online publication and is updated daily on week days.
Initial download of the metrics may take a while.