Fig. 2
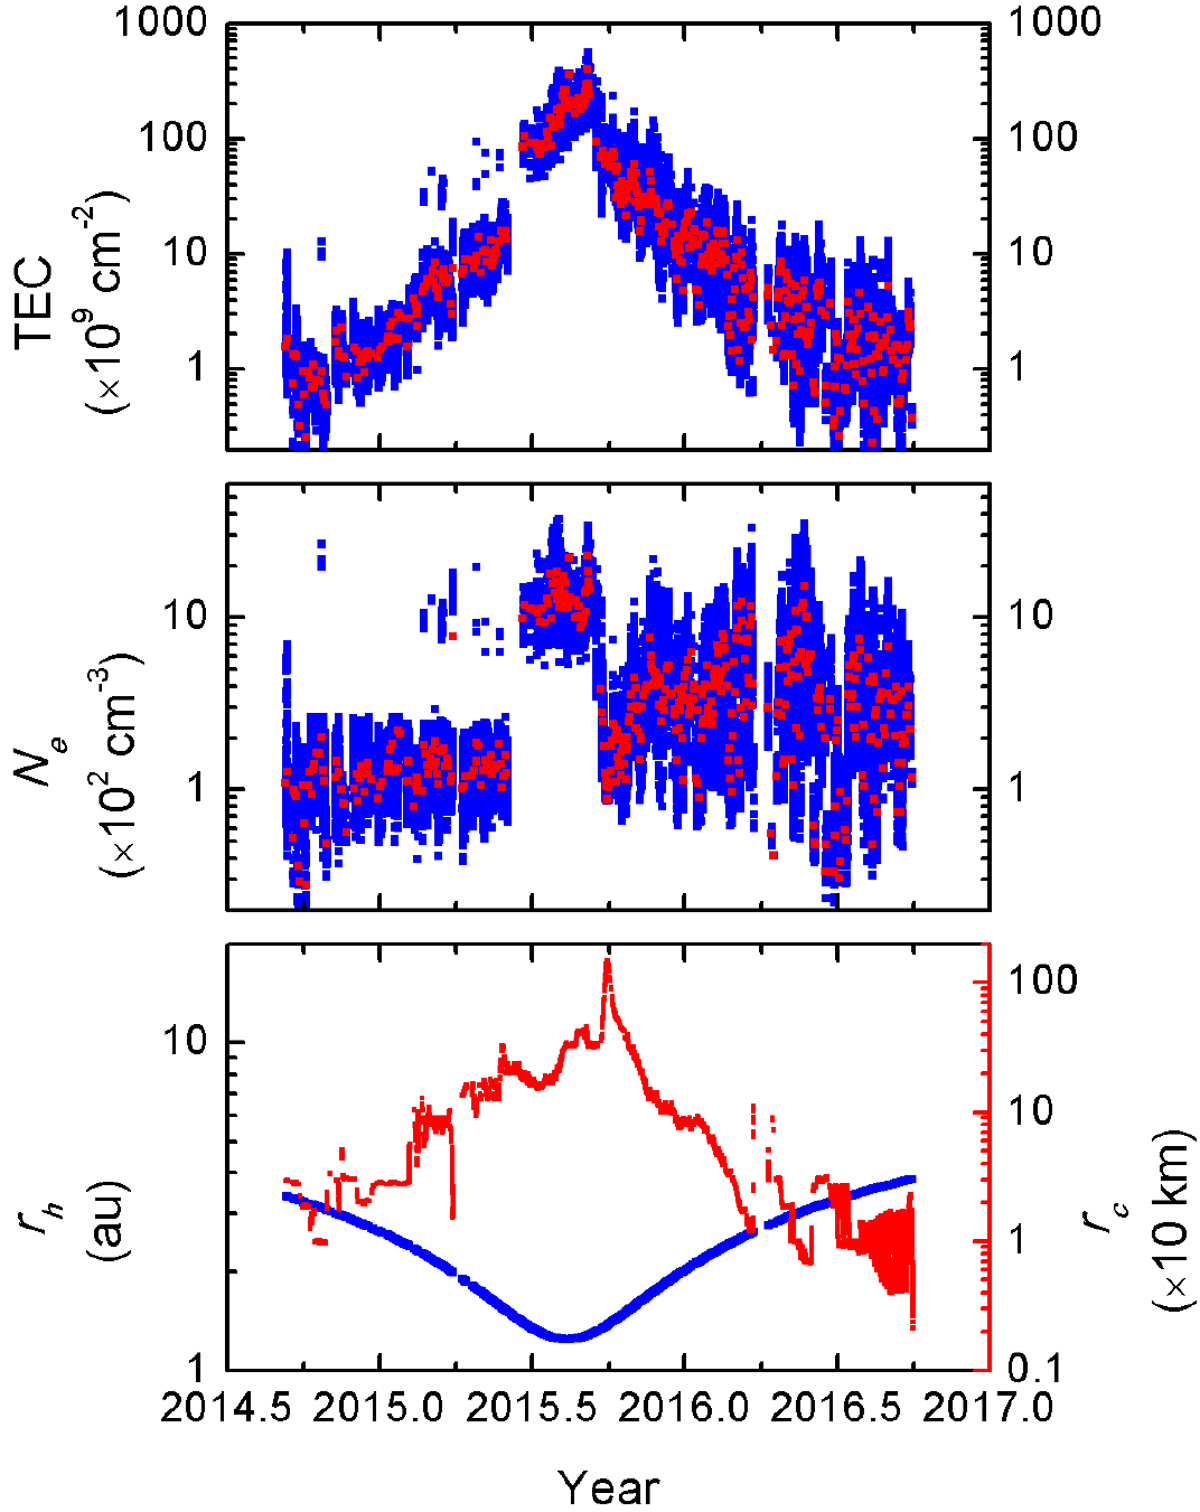
Ionosphere of comet 67P during the Rosetta mission. From top to bottom panels: ionospheric TEC derived from RPC-MIP, observed electron density (Ne) along the Rosetta spacecraft trajectory, and heliocentric distance (rh) of comet 67P (blue, scale on the left), and cometocentric distance (rc) of Rosetta from 67P (red, scale on the right), respectively. Top two panels: the blue points show 320 s average data and red shows the corresponding daily averages (see Sect. 2).
Current usage metrics show cumulative count of Article Views (full-text article views including HTML views, PDF and ePub downloads, according to the available data) and Abstracts Views on Vision4Press platform.
Data correspond to usage on the plateform after 2015. The current usage metrics is available 48-96 hours after online publication and is updated daily on week days.
Initial download of the metrics may take a while.