Fig. 5
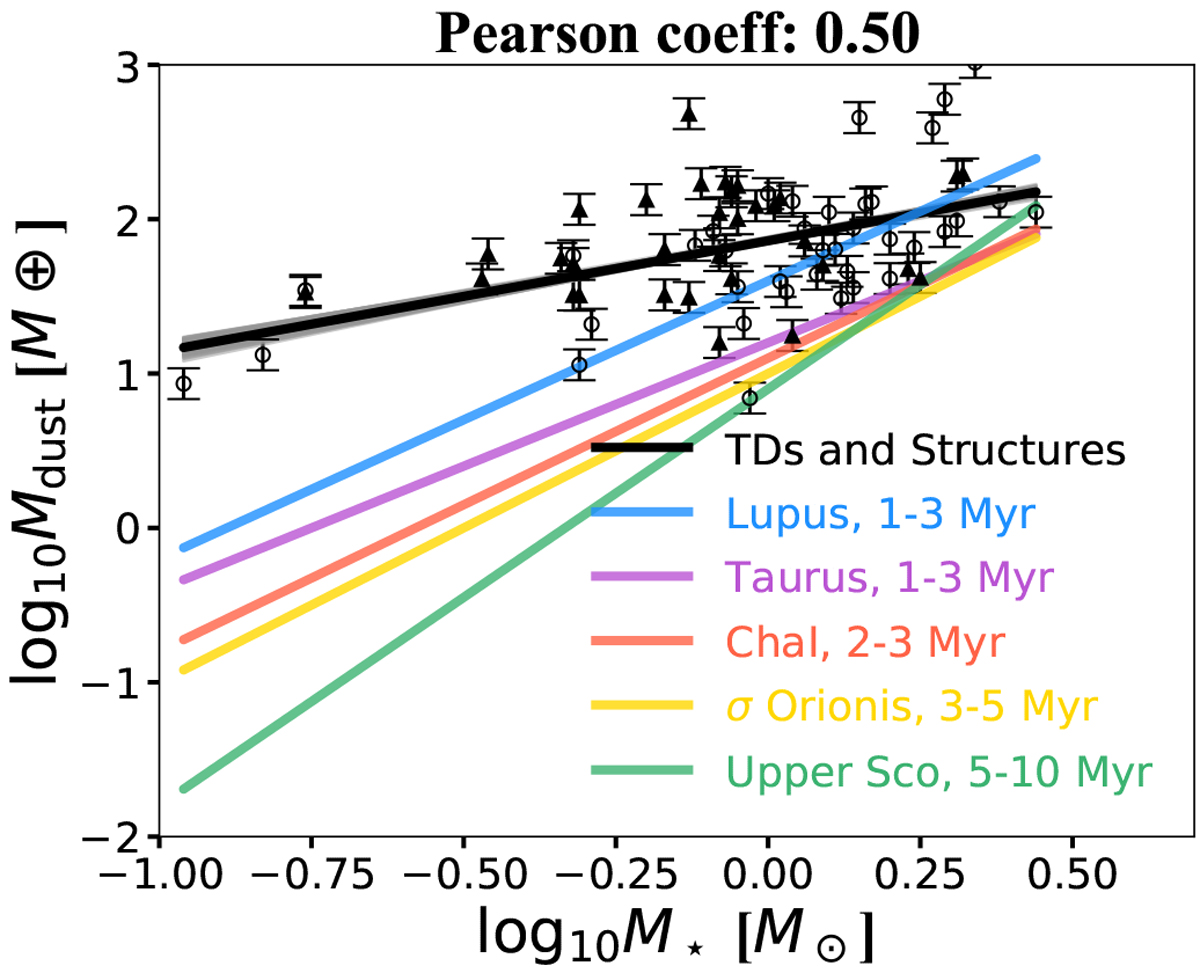
Mdust−M⋆ relation in different star-forming regions (colors) and for the disks with resolved cavities or transition disks (TDs, open circles) and disks with structures (full triangles, see appendix). The values for the slope and intercept for the different star forming regions are taken from Pascucci et al. (2016), except for σ-Orionis, which values are from Ansdell et al. (2017). From fitting this relation for TDs and disk with structures, we used log10 (Mdust∕M⊕) = βlog10(M⋆∕M⊙) + α, and we obtained ![]() and
and ![]() and a Pearson coefficient of 0.50. The fit takes into account the uncertainties of the data, which are dominated by the 10% of uncertainty from flux calibration.
and a Pearson coefficient of 0.50. The fit takes into account the uncertainties of the data, which are dominated by the 10% of uncertainty from flux calibration.
Current usage metrics show cumulative count of Article Views (full-text article views including HTML views, PDF and ePub downloads, according to the available data) and Abstracts Views on Vision4Press platform.
Data correspond to usage on the plateform after 2015. The current usage metrics is available 48-96 hours after online publication and is updated daily on week days.
Initial download of the metrics may take a while.