Open Access
Fig. 2
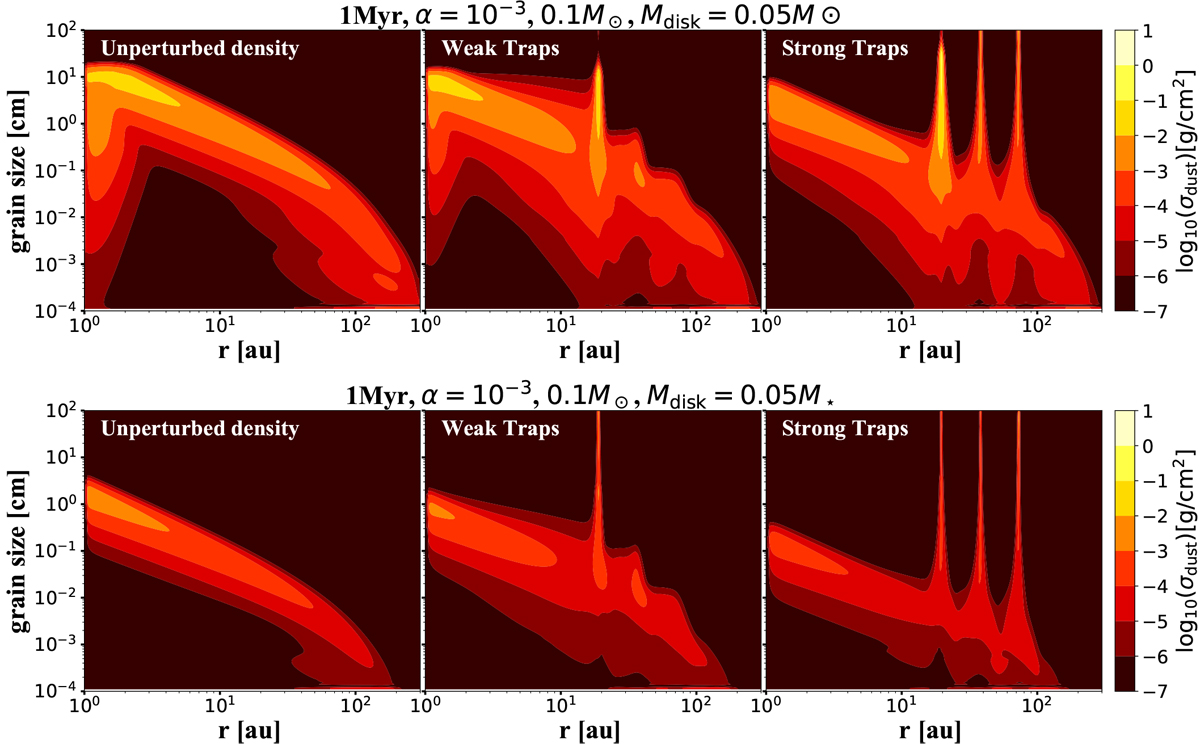
Dust density distribution after 1 Myr of evolution for no traps (left panel), weak traps (middle panel), and strong traps (right panel), for the case of M⋆ = 0.1M⊙ and α = 10−3. Top panels: the disk mass is Mdisk = 0.05 M⊙. Bottom panels: the disk mass is Mdisk = 0.05 M⋆.
Current usage metrics show cumulative count of Article Views (full-text article views including HTML views, PDF and ePub downloads, according to the available data) and Abstracts Views on Vision4Press platform.
Data correspond to usage on the plateform after 2015. The current usage metrics is available 48-96 hours after online publication and is updated daily on week days.
Initial download of the metrics may take a while.