Fig. 1.
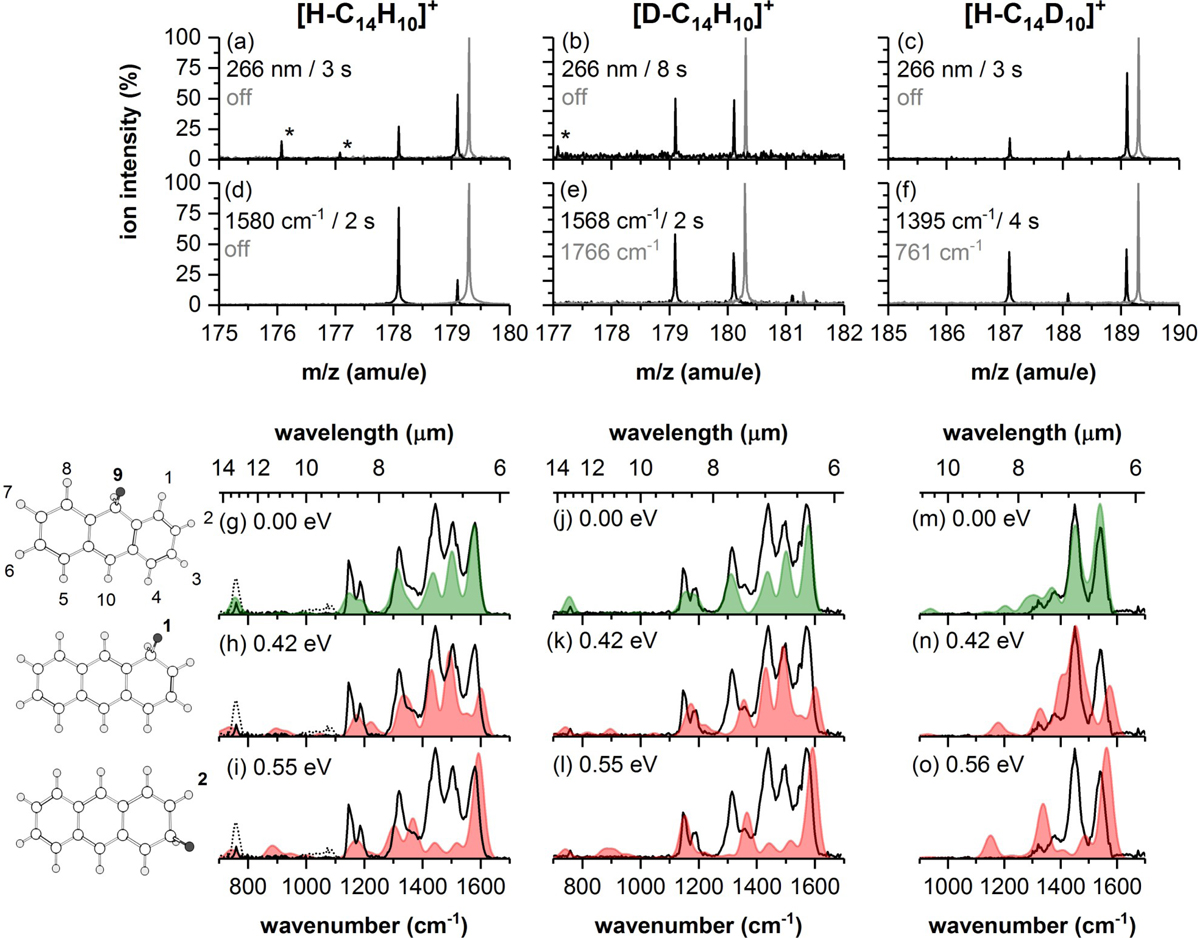
Fragmentation mass (panels a–f) and IRMPD spectra (g–o) recorded for three different anthracene isotopologs: protonated anthracene – [H − C14H10]+, m/z = 179.09 (left column); deuteronated anthracene – [D − C14H10]+, m/z = 180.09 (middle column); protonated, perdeuterated anthracene – [H − C14D10]+, m/z = 189.09 (right column). For all mass spectra, black traces represent the fragmentation mass spectra, while gray traces are reference precursor mass spectra (with laser on or off-resonance). The gray traces are shifted up 0.2 amu to enhance their visibility. The top row are mass spectra following UV irradiation, the second row following IR irradiation at the indicated IR frequency. Experimental IR spectra are shown in black, superimposed on color shaded calculated spectra for each species with the protonation (deuteronation) site indicated in the structures left of the panels. The theoretical IR spectra were calculated using B3LYP/6-311++G(2d,p) and the ground-state energies in M06-2X/6-311++G(2d,p). Spectra that are considered to “match” are colored green; the ones that are considered to not match are red. Relative energies for each structure are shown above their respective spectra. The dotted curve in panels g,h,i represents the measurement assisted by the CO2-laser.
Current usage metrics show cumulative count of Article Views (full-text article views including HTML views, PDF and ePub downloads, according to the available data) and Abstracts Views on Vision4Press platform.
Data correspond to usage on the plateform after 2015. The current usage metrics is available 48-96 hours after online publication and is updated daily on week days.
Initial download of the metrics may take a while.