Fig. B.1.
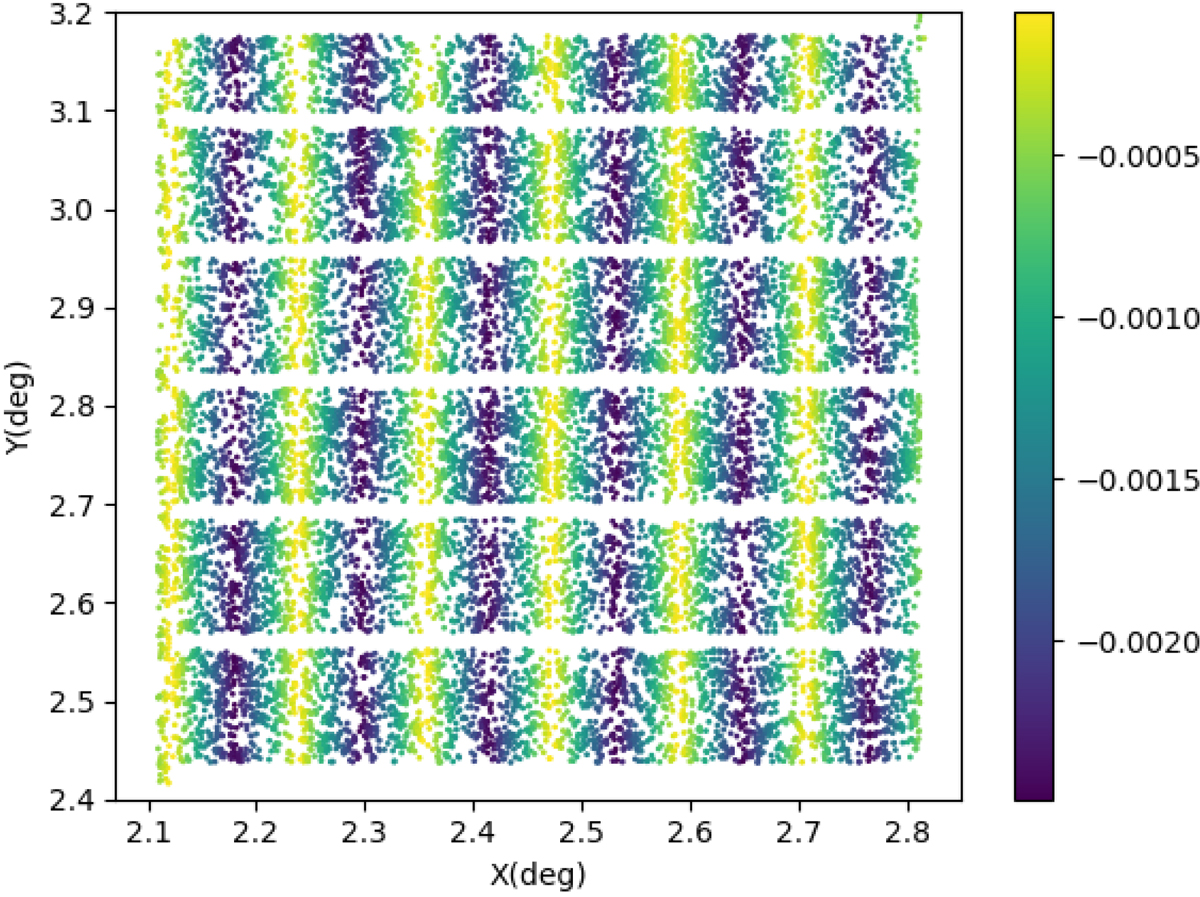
Random selection of galaxies are shown representing the pattern of the induced polarisations owing to imperfect CTI mitigation in one field of view. The biases are larger with distance from the readout nodes on either side of the CCDs. Biases are only considered in the serial direction.
Current usage metrics show cumulative count of Article Views (full-text article views including HTML views, PDF and ePub downloads, according to the available data) and Abstracts Views on Vision4Press platform.
Data correspond to usage on the plateform after 2015. The current usage metrics is available 48-96 hours after online publication and is updated daily on week days.
Initial download of the metrics may take a while.