Fig. 4.
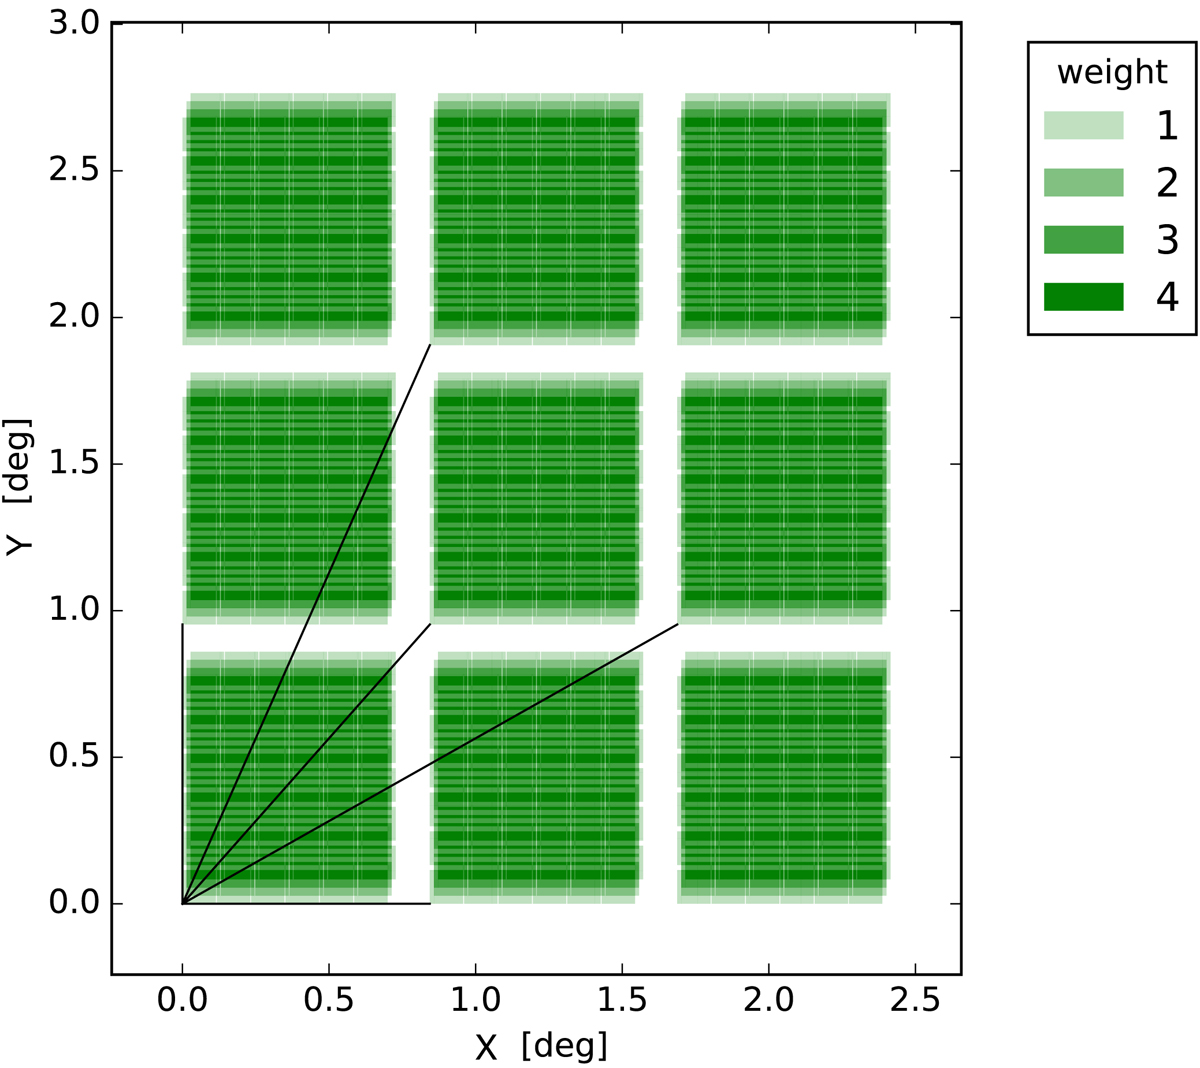
Part of the observed area with 3 slews in each direction and 4 dithers for each slew. The slews are plotted at 1.2× their nominal value for presentation purposes, causing apparent gaps, which are not present in the actual simulated survey. The lines show some of the correlated scales relating to the same point in each field of view. We also note that there are correlations at 2×,3×,n× of these harmonic scales. It should be noted that relevant scales are determined by the distances between the fields of view, not the size of the field of view itself.
Current usage metrics show cumulative count of Article Views (full-text article views including HTML views, PDF and ePub downloads, according to the available data) and Abstracts Views on Vision4Press platform.
Data correspond to usage on the plateform after 2015. The current usage metrics is available 48-96 hours after online publication and is updated daily on week days.
Initial download of the metrics may take a while.