Fig. 3.
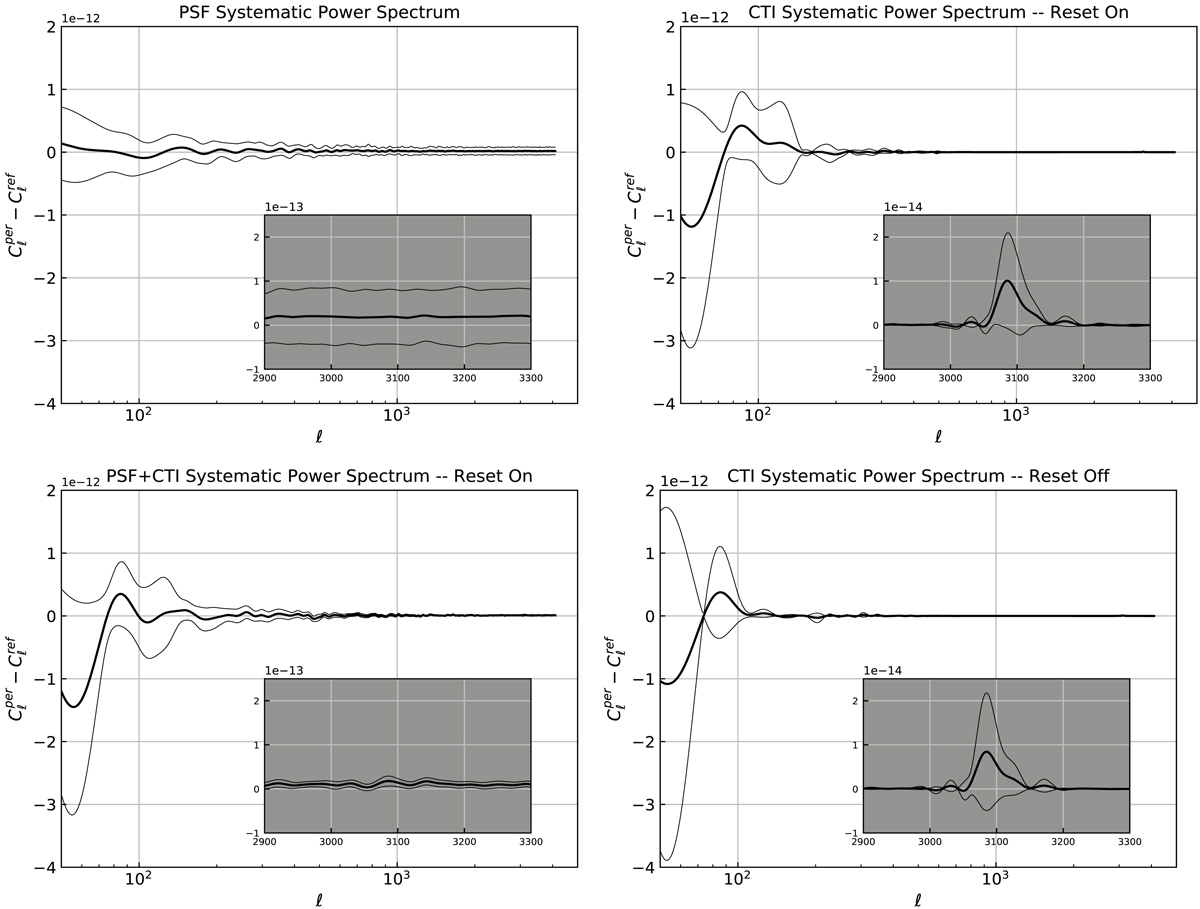
Residual power spectra caused by imperfect removal of systematic effects. Thin lines show 68% intervals. Top left panel: residual power spectrum due to PSF, caused by the limited precision with which the nominal focus position can be determined from the stars in the data; it can be seen that residuals have on average been removed. Top right panel: residual power spectrum caused by CTI when the CTI-removal model parameters are updated throughout the survey (reset on case, see text for details). There are residuals on the scales corresponding to half the distance between the CCDs, as shown in the insets. Bottom right panel: results when the CTI-removal model parameters are kept constant during the survey (reset off). As can be seen the residuals have a slightly wider distribution compared to the reset on case. Bottom left panel: residual systematic effects from uncertainties in the modelling of both PSF and detector effects; as shown in the inset the two effects seem to work in opposite directions, where the positive offset present in the PSF-only case has reduced in the combined case. We note that owing to the sensitivity of dark energy parameters to relatively large angular scales ℓ ≃ 50−1000, the deviations on these scales are of more importance.
Current usage metrics show cumulative count of Article Views (full-text article views including HTML views, PDF and ePub downloads, according to the available data) and Abstracts Views on Vision4Press platform.
Data correspond to usage on the plateform after 2015. The current usage metrics is available 48-96 hours after online publication and is updated daily on week days.
Initial download of the metrics may take a while.