Fig. 5.
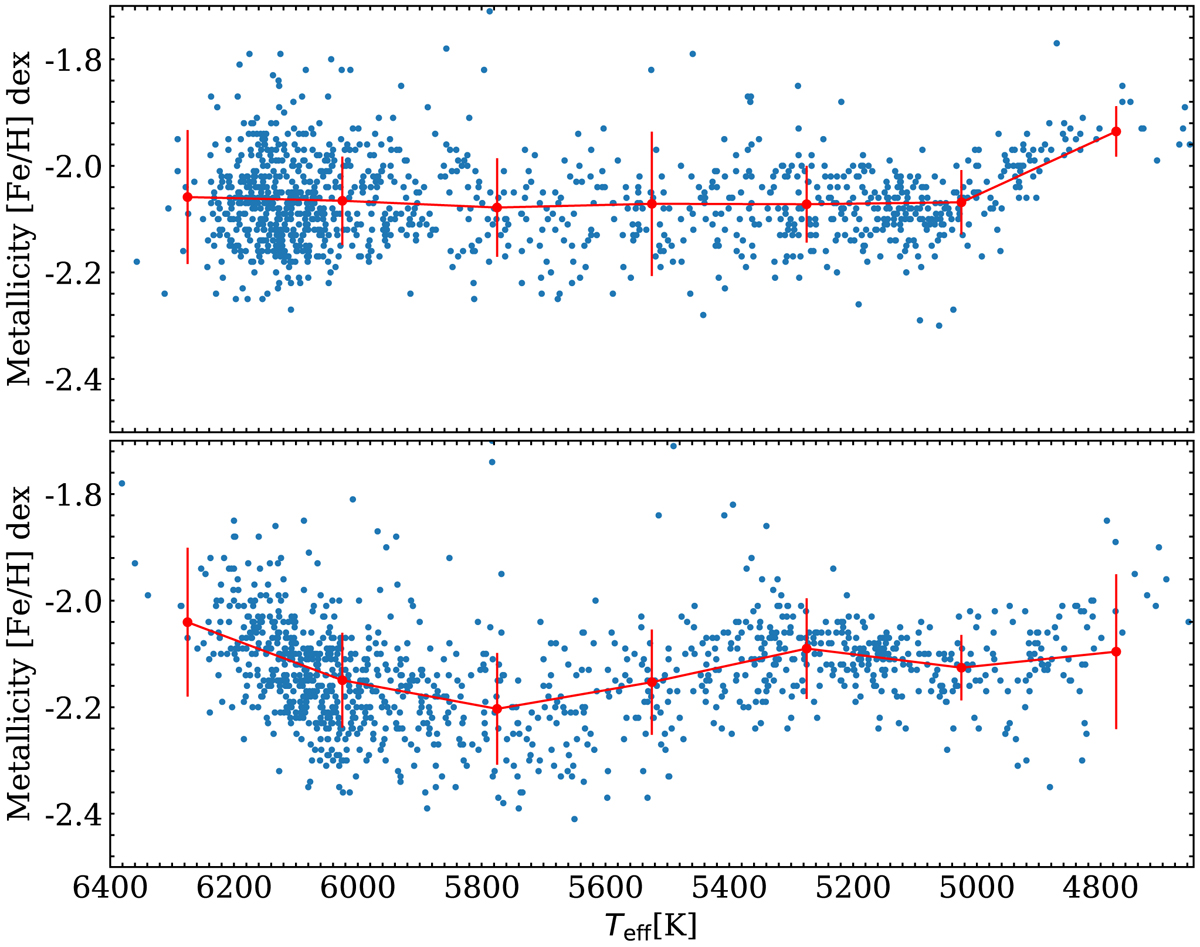
[Fe/H] vs. Teff for the giants (log g < 4.2 dex), with log g determined spectroscopically. Top panel: results obtained with the ELODIE interpolator, and bottom panel: those obtained with the MILES interpolator. The solid red line connects the mean values and standard deviations of the metallicity in 250 K wide bins. The difference with Fig. 3 is that log g was this time determined by the full-spectrum fitting, not by photometry.
Current usage metrics show cumulative count of Article Views (full-text article views including HTML views, PDF and ePub downloads, according to the available data) and Abstracts Views on Vision4Press platform.
Data correspond to usage on the plateform after 2015. The current usage metrics is available 48-96 hours after online publication and is updated daily on week days.
Initial download of the metrics may take a while.