Open Access
Fig. 4.
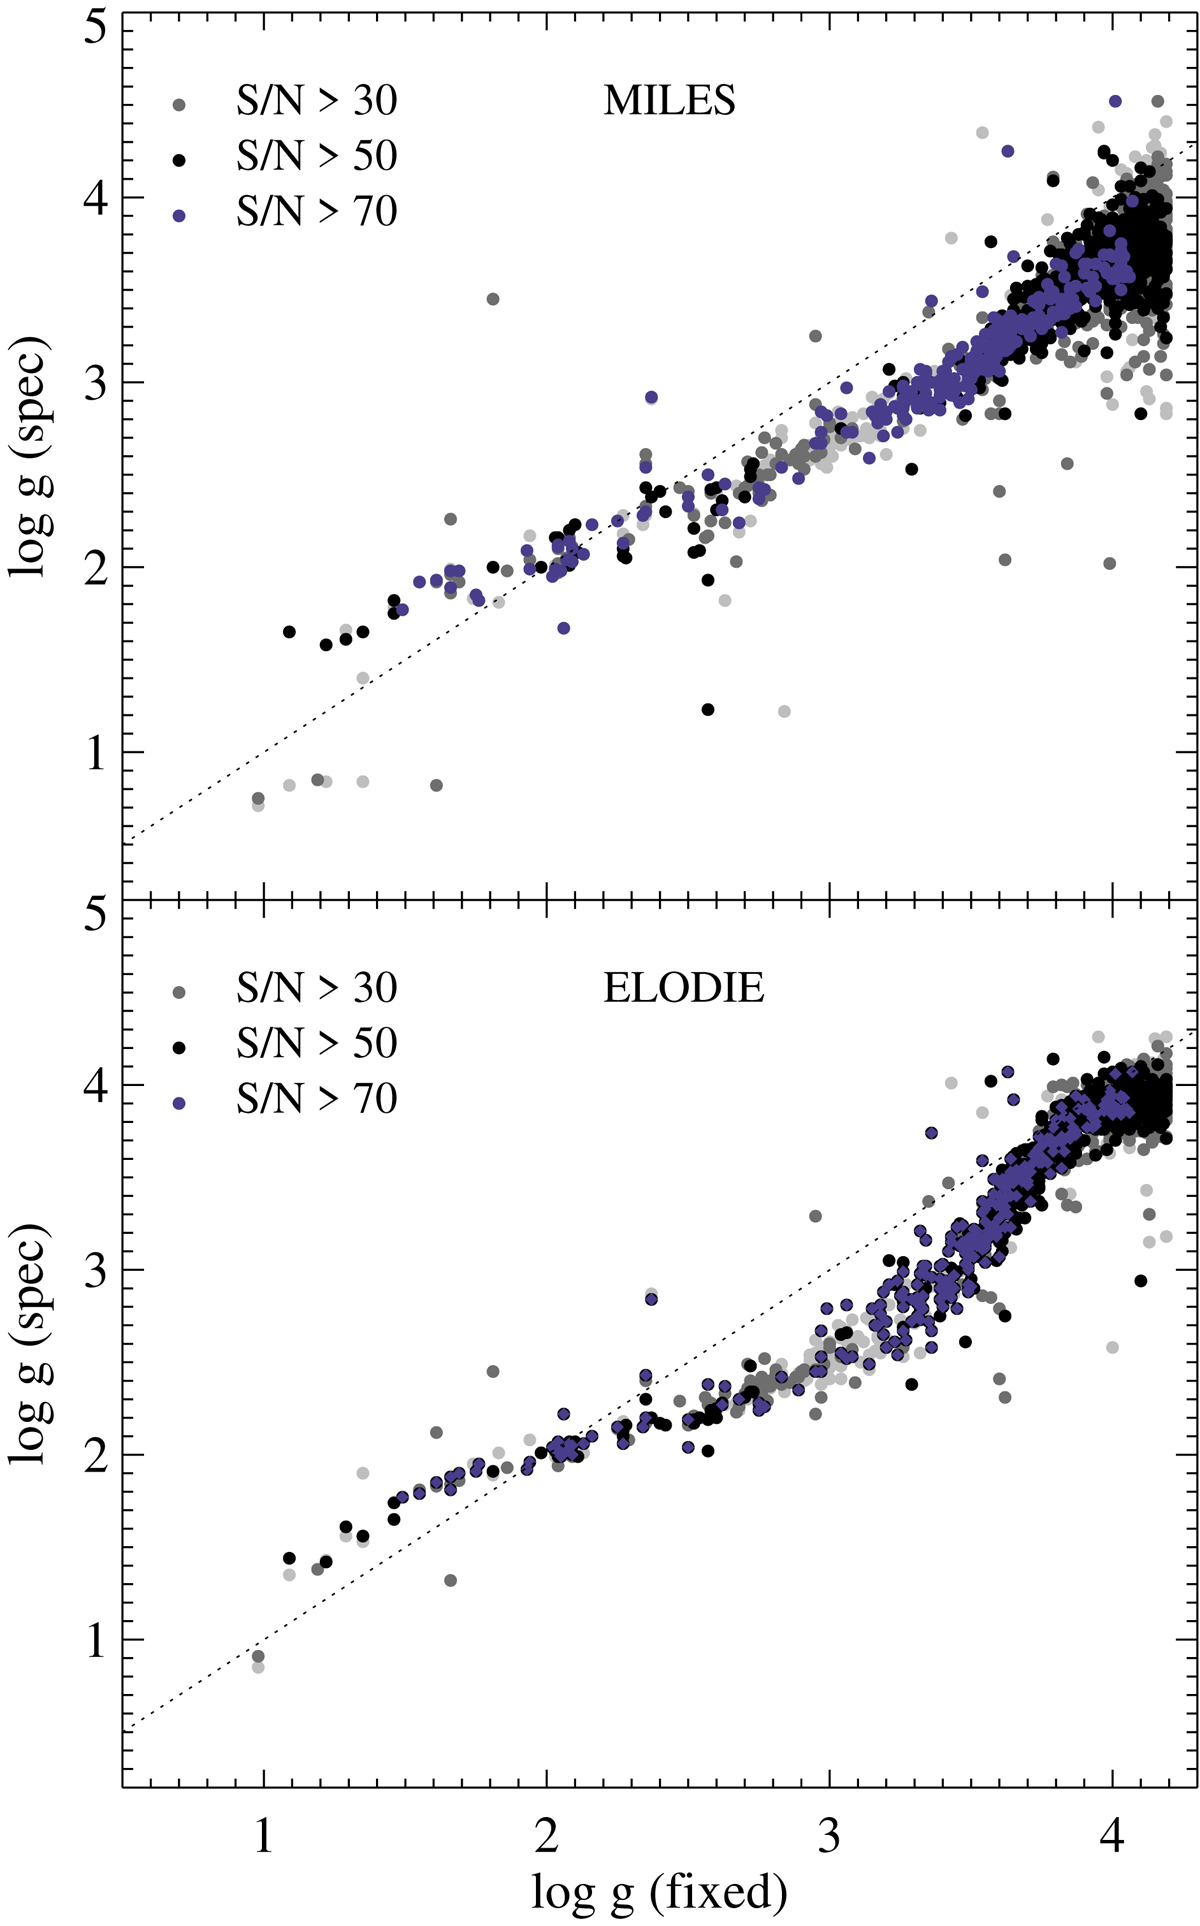
Comparison between the spectroscopic and photometric log g. The dotted line is the 1:1 correspondence, the color of the symbol reflects S/R as indicated in the figure. Top panel: MILES analysis and bottom panel: that of ELODIE.
Current usage metrics show cumulative count of Article Views (full-text article views including HTML views, PDF and ePub downloads, according to the available data) and Abstracts Views on Vision4Press platform.
Data correspond to usage on the plateform after 2015. The current usage metrics is available 48-96 hours after online publication and is updated daily on week days.
Initial download of the metrics may take a while.