Fig. 1.
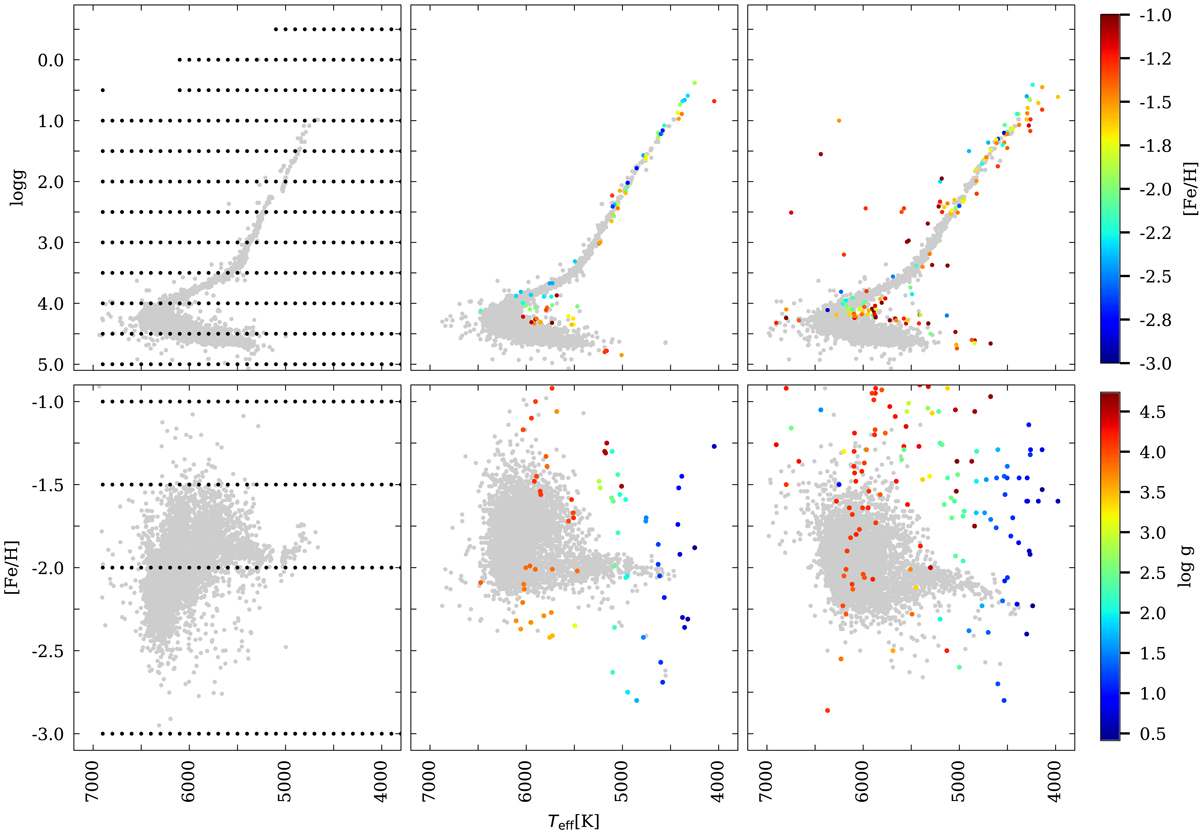
Distribution of the library spectra in the region of the parameter space occupied by the cluster stars. The gray dots represent the H16 measurements of the cluster members. The top graphics are the projections in the log g vs. Teff plane and the bottom graphics show the [Fe/H] vs. Teff projections. The overplotted colored points are the location of the reference spectra in the three libraries used in this paper. Left panel: Göttingen Spectral Library used by H16, central panel: ELODIE library, and right panel: MILES library. These last two libraries were used in tour reanalysis. Only the library stars corresponding to the region mapped by the our sample are shown: Teff < 7000 K, and −3.04 < [Fe/H] < −0.88 dex (77 stars for ELODIE and 137 for MILES, including 40 and 46 stars, respectively with [Fe/H] < −1.7 dex). The color scales for the ELODIE and MILES libraries are indicated on the right.
Current usage metrics show cumulative count of Article Views (full-text article views including HTML views, PDF and ePub downloads, according to the available data) and Abstracts Views on Vision4Press platform.
Data correspond to usage on the plateform after 2015. The current usage metrics is available 48-96 hours after online publication and is updated daily on week days.
Initial download of the metrics may take a while.