Fig. 3
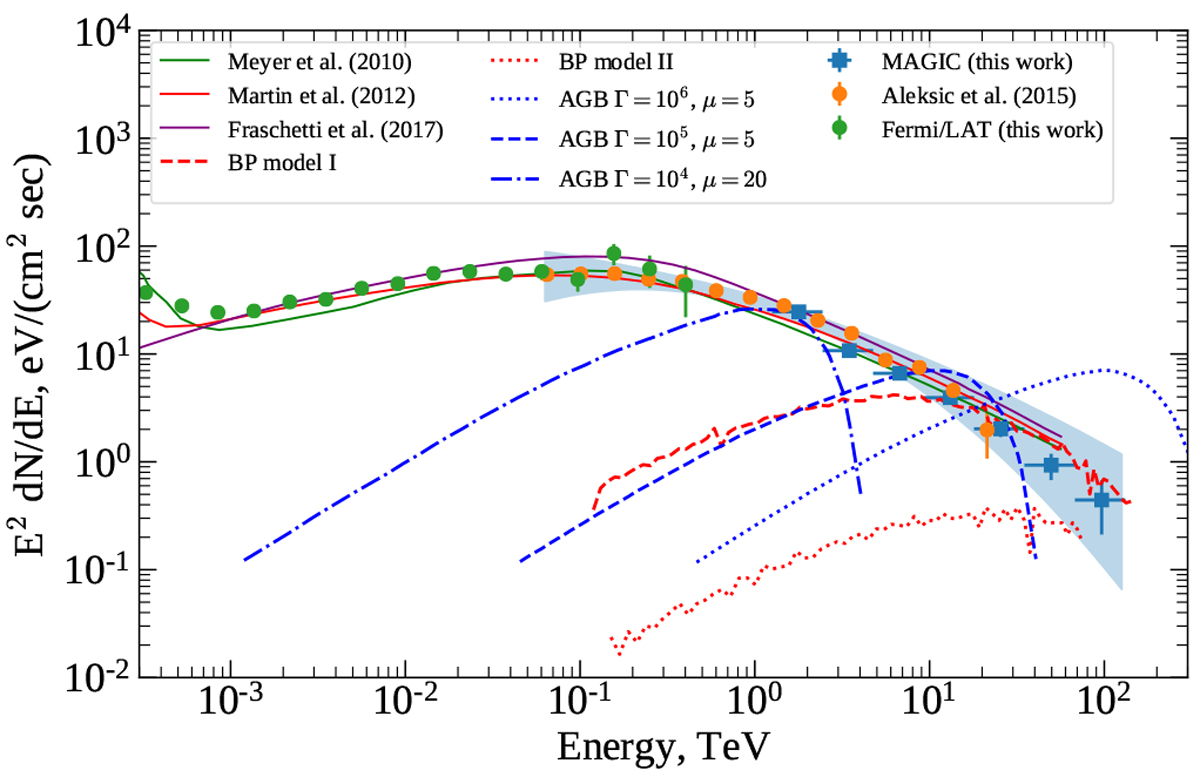
Crab Nebula spectrum obtained here compared to the lower energy measurements with MAGIC (Aleksić et al. 2015) and Fermi/ LAT. The blue shaded band denotes the 68% confidence flux range, estimated from the fit with the log-parabola function. Solid lines of different colours show several leptonic models from Meyer et al. (2010), Aleksić et al. (2015) and Fraschetti & Pohl (2017), previously constructed for the Crab Nebula. Dashed lines denote predictions for hadronic contribution from Bednarek & Protheroe (1997) (BP), and Amato et al. (2003) (AGB). Shown is the bulk wind Lorentz factor (Γ), and ![]() is the effective target material density increase over its mean value.
is the effective target material density increase over its mean value.
Current usage metrics show cumulative count of Article Views (full-text article views including HTML views, PDF and ePub downloads, according to the available data) and Abstracts Views on Vision4Press platform.
Data correspond to usage on the plateform after 2015. The current usage metrics is available 48-96 hours after online publication and is updated daily on week days.
Initial download of the metrics may take a while.