Fig. 2
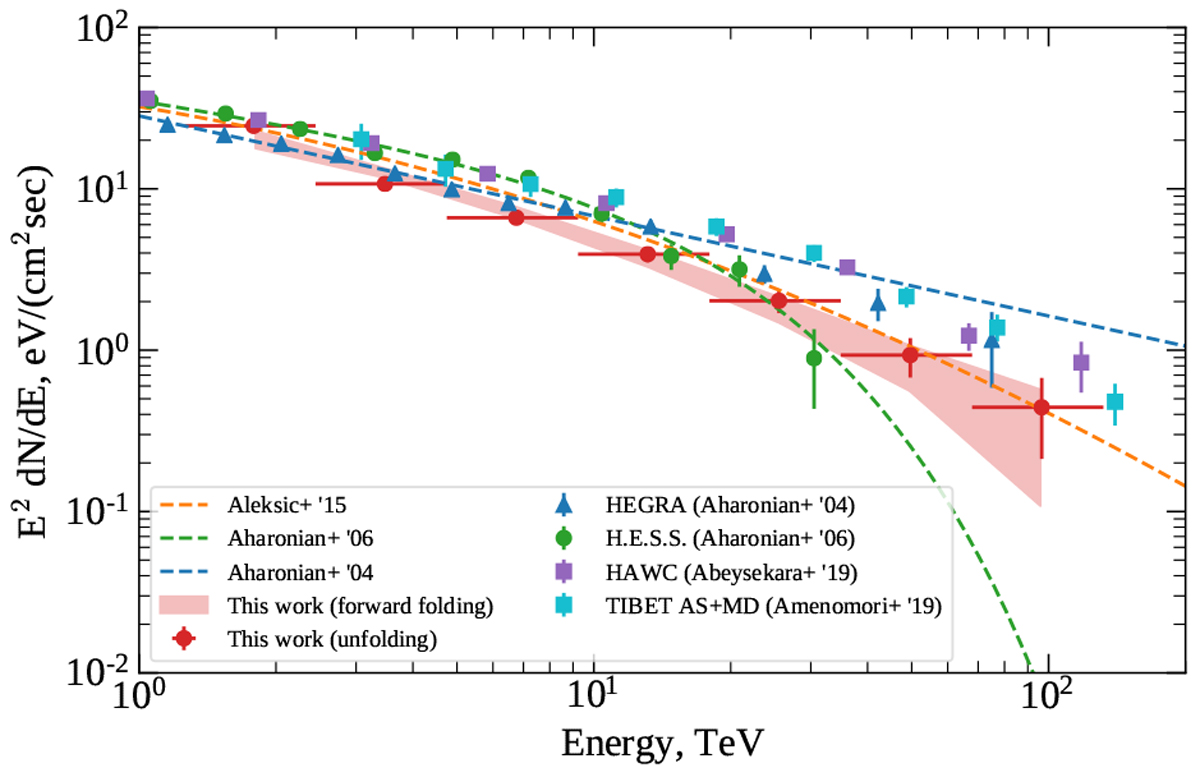
Spectral energy distribution of the Crab Nebula, obtained with MAGIC VLZA observations (red). Results of the spectral unfolding (data points) and of the forward-folding (band) procedures are shown. Dashed colored lines (blue, green, and orange, respectively) denote the archival best fits to the Crab Nebula spectra from Aharonian et al. (2004, 2006), and Aleksić et al. (2015). Data points from Aharonian et al. (2004, 2006), Abeysekara et al. (2019) and Amenomori et al. (2019) are also shown for comparison.
Current usage metrics show cumulative count of Article Views (full-text article views including HTML views, PDF and ePub downloads, according to the available data) and Abstracts Views on Vision4Press platform.
Data correspond to usage on the plateform after 2015. The current usage metrics is available 48-96 hours after online publication and is updated daily on week days.
Initial download of the metrics may take a while.