Fig. 1
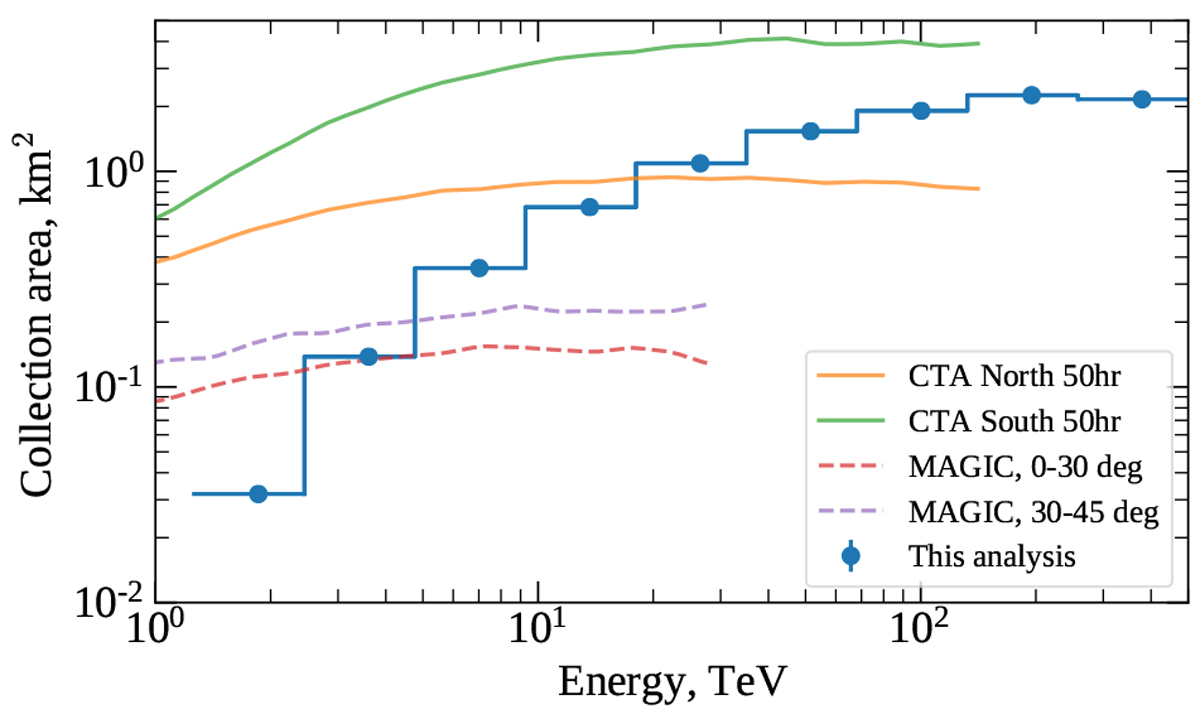
MAGIC collection area, estimated for an observational sample in the zenith angle range 70°− 80° with Monte Carlo simulations (see also Mirzoyan et al. 2018), and for comparison the collection area (for 20° zenith angle observations in so-called Production 3 layout) of the future CTA array (see Sect. 4 for details). Also shown is the MAGIC collection area at lower zenith angles from Aleksić et al. (2016a).
Current usage metrics show cumulative count of Article Views (full-text article views including HTML views, PDF and ePub downloads, according to the available data) and Abstracts Views on Vision4Press platform.
Data correspond to usage on the plateform after 2015. The current usage metrics is available 48-96 hours after online publication and is updated daily on week days.
Initial download of the metrics may take a while.