Free Access
Fig. 2.
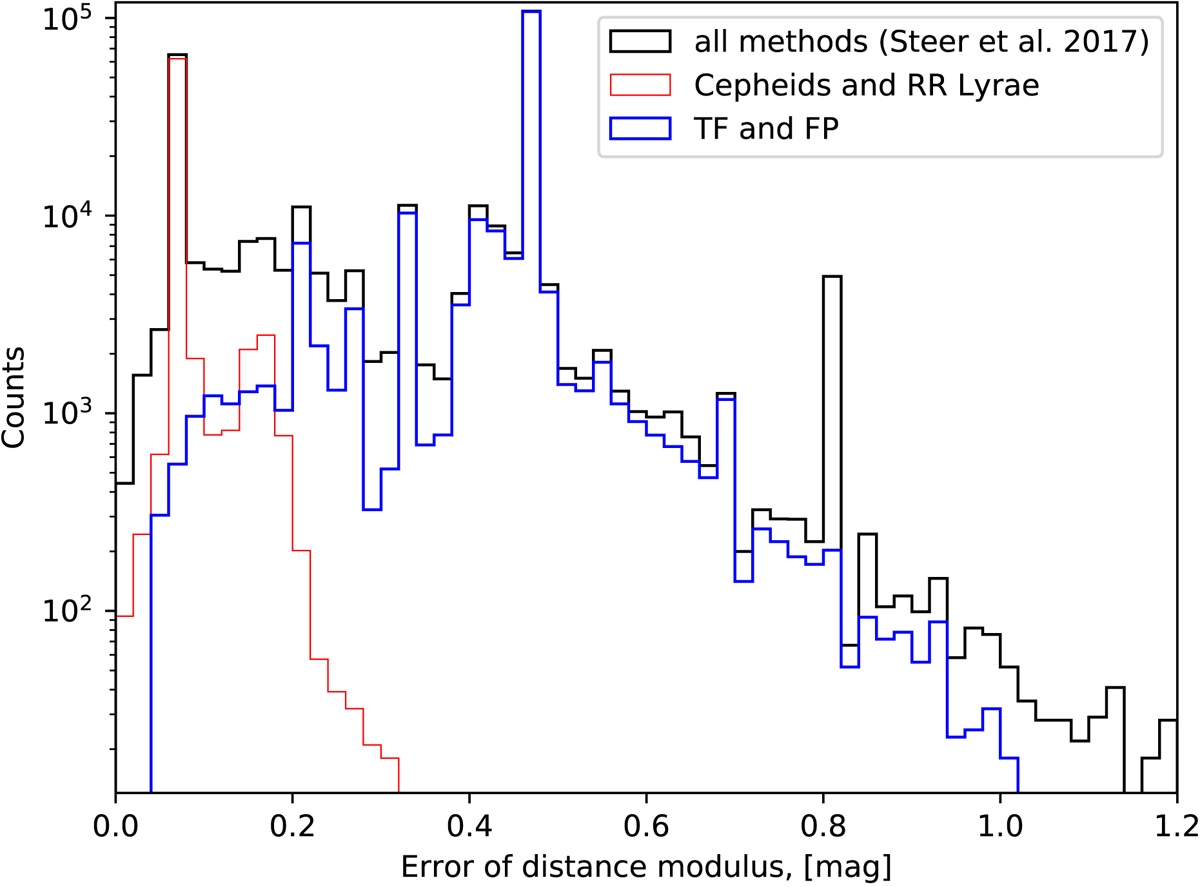
Distribution of distance modulus errors for all galaxies from Steer et al. (2017) (black line). As an example, the distributions are shown for typical methods: Cepheids and RR Lyrae (red thin line), TF and FP relations methods (blue thick line).
Current usage metrics show cumulative count of Article Views (full-text article views including HTML views, PDF and ePub downloads, according to the available data) and Abstracts Views on Vision4Press platform.
Data correspond to usage on the plateform after 2015. The current usage metrics is available 48-96 hours after online publication and is updated daily on week days.
Initial download of the metrics may take a while.