Fig. 9
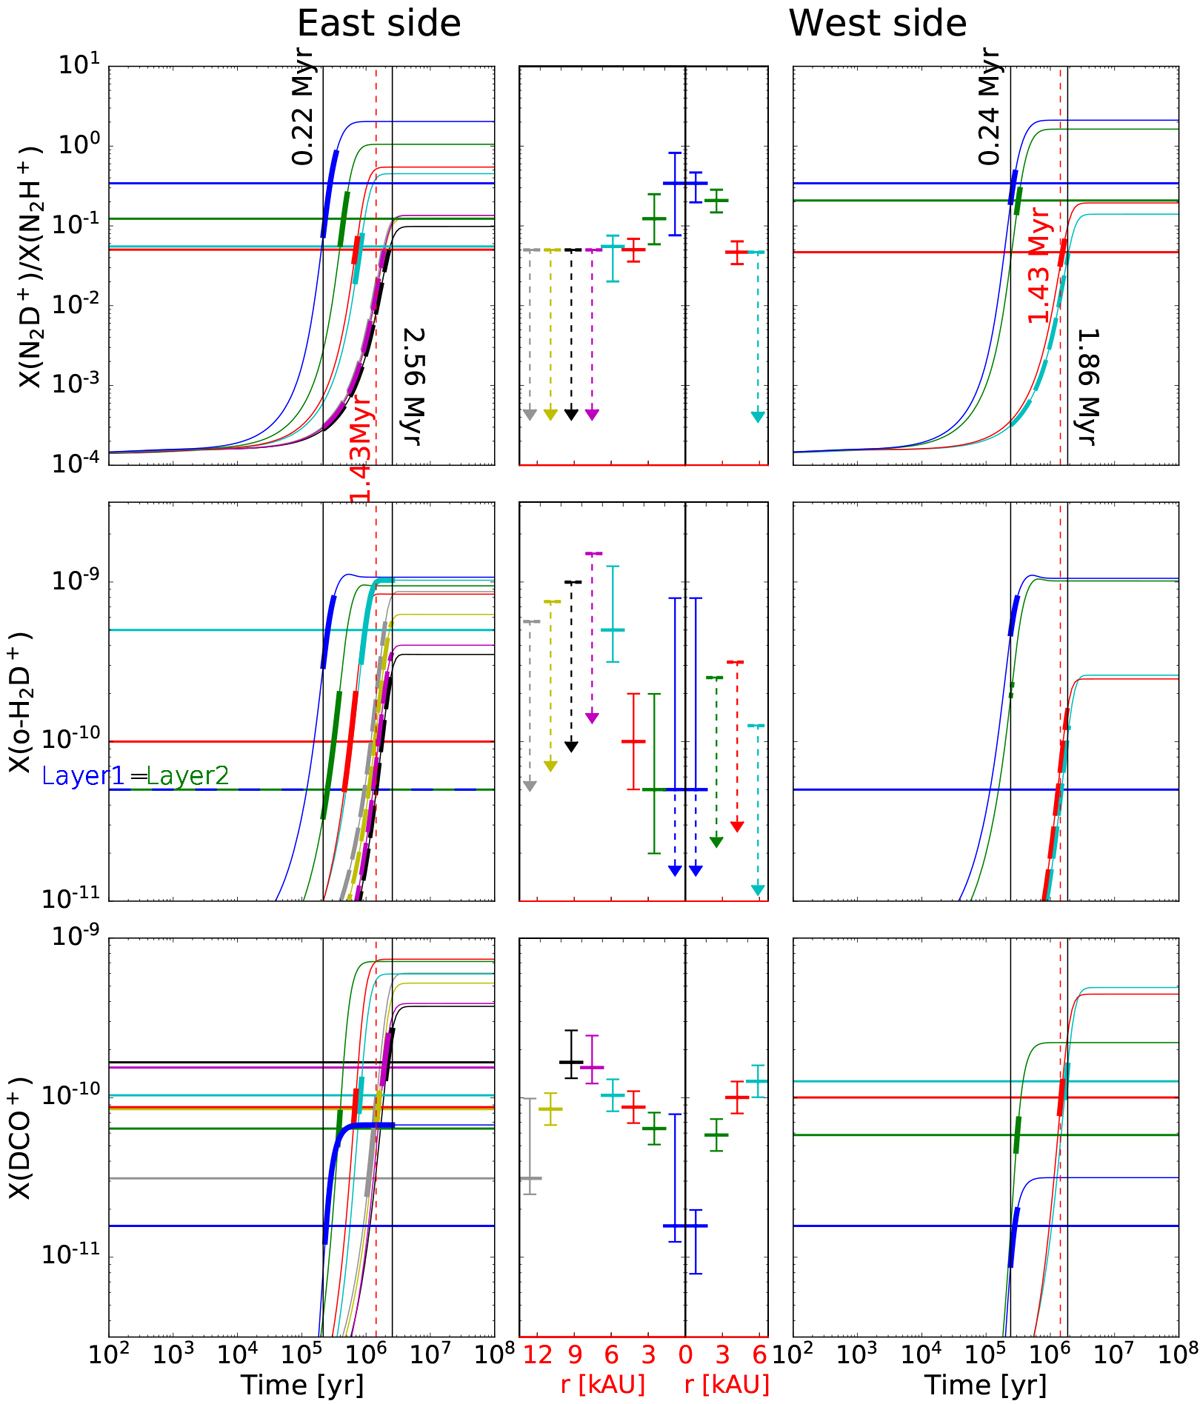
Chemical modeling of the abundance ratio of N2D+/N2H+ and the abundances of ortho-H2D+ and DCO+ for each layer. Left and right columns: chemical solutions. Middle column: observationally derived profiles from Fig. 8. Each color represents a layer. In the chemical solution plots, the horizontal solid lines are the observationally derived X(N2D+)/X(N2H+), X(ortho-H2D+), and X(DCO+). The growing curves are the chemical solutions calculated with an average grain size (agr) of 0.1 μm and a cosmicray ionization rate (ζ) of 10−17 s−1. The two black vertical lines in each panel indicate a time range for which the model values cross the observations within their error bars and where the model curves become thicker. Thick dashed lines denote the model range that is both lower than the observed upper limit for that layer and within the global time range of the model. The red dashed vertical lines indicate the lower limit on the lifetime scale of L1512.
Current usage metrics show cumulative count of Article Views (full-text article views including HTML views, PDF and ePub downloads, according to the available data) and Abstracts Views on Vision4Press platform.
Data correspond to usage on the plateform after 2015. The current usage metrics is available 48-96 hours after online publication and is updated daily on week days.
Initial download of the metrics may take a while.