Fig. 7
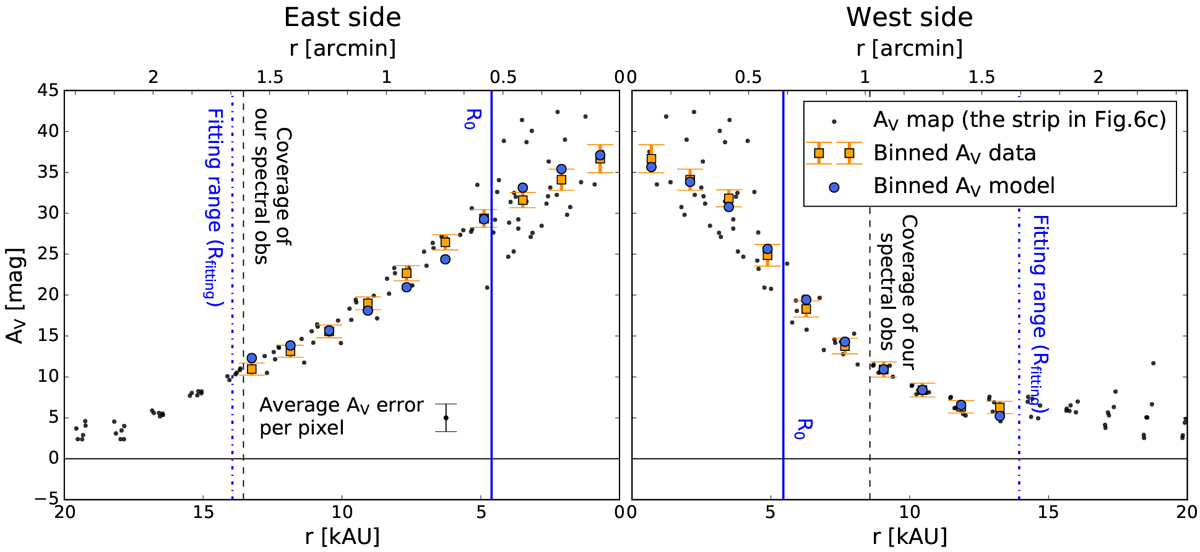
Plummer-like density profile fittings. The black dots are the AV values at each pixel in the horizontal strip shown in Fig. 6c but these are separated between the east and west sides. The orange squares with error bars show the averaged AV profiles, which are azimuthally binned with radial 10′′ bin. The blue circles show the best-fitted AV models for the east and west sides. The AV models are derived from spherically symmetrical Plummer-like density profiles. The best-fitted characteristic radii, R0, and the fitting ranges, Rfitting of the AV models are denoted in blue solid and dash-dotted lines, respectively. The coverage of our spectral observations are denoted in black dashed lines.
Current usage metrics show cumulative count of Article Views (full-text article views including HTML views, PDF and ePub downloads, according to the available data) and Abstracts Views on Vision4Press platform.
Data correspond to usage on the plateform after 2015. The current usage metrics is available 48-96 hours after online publication and is updated daily on week days.
Initial download of the metrics may take a while.