Fig. 6
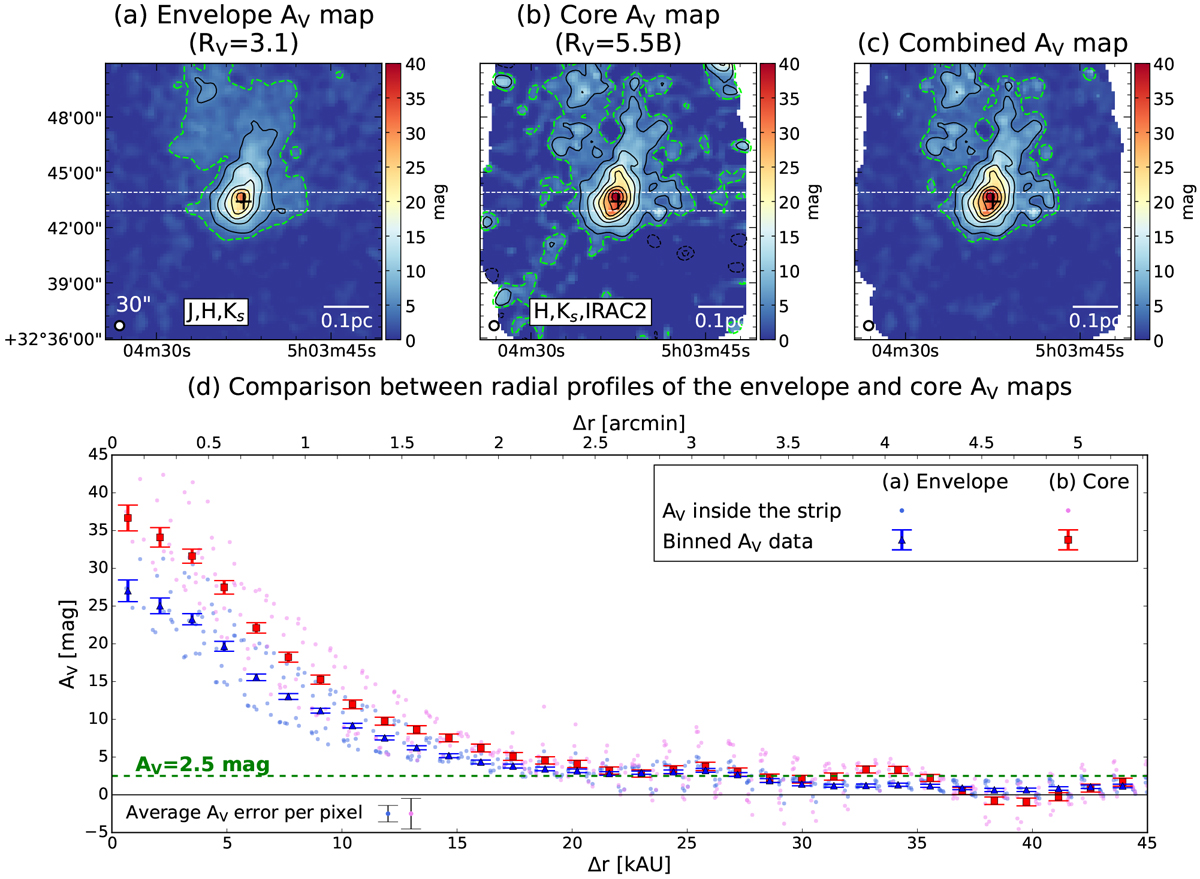
Visualextinction maps and profiles. (a) Envelope AV map derived from J, H, and Ks bands with the RV = 3.1 model. (b) Core AV map derived from H, Ks, and IRAC2 bands with the RV = 5.5 B model. (c) Combined AV map merged from the previous maps with boundaries at AV = 2.5 mag. Each map is convolved with a Gaussian beam size of 30′′. (d) Comparison between AV profiles inside the strips of panel a and b. The AV values at each pixel are denoted in light blue and pink dots, while their average errors are indicated in the bottom left corner. The AV profiles are averaged in azimuth with radial 10′′ bin and shown in blue triangles and red squares with their error bars. The green dashed lines in the four planes indicate the AV threshold of 2.5 mag.
Current usage metrics show cumulative count of Article Views (full-text article views including HTML views, PDF and ePub downloads, according to the available data) and Abstracts Views on Vision4Press platform.
Data correspond to usage on the plateform after 2015. The current usage metrics is available 48-96 hours after online publication and is updated daily on week days.
Initial download of the metrics may take a while.