Fig. 5
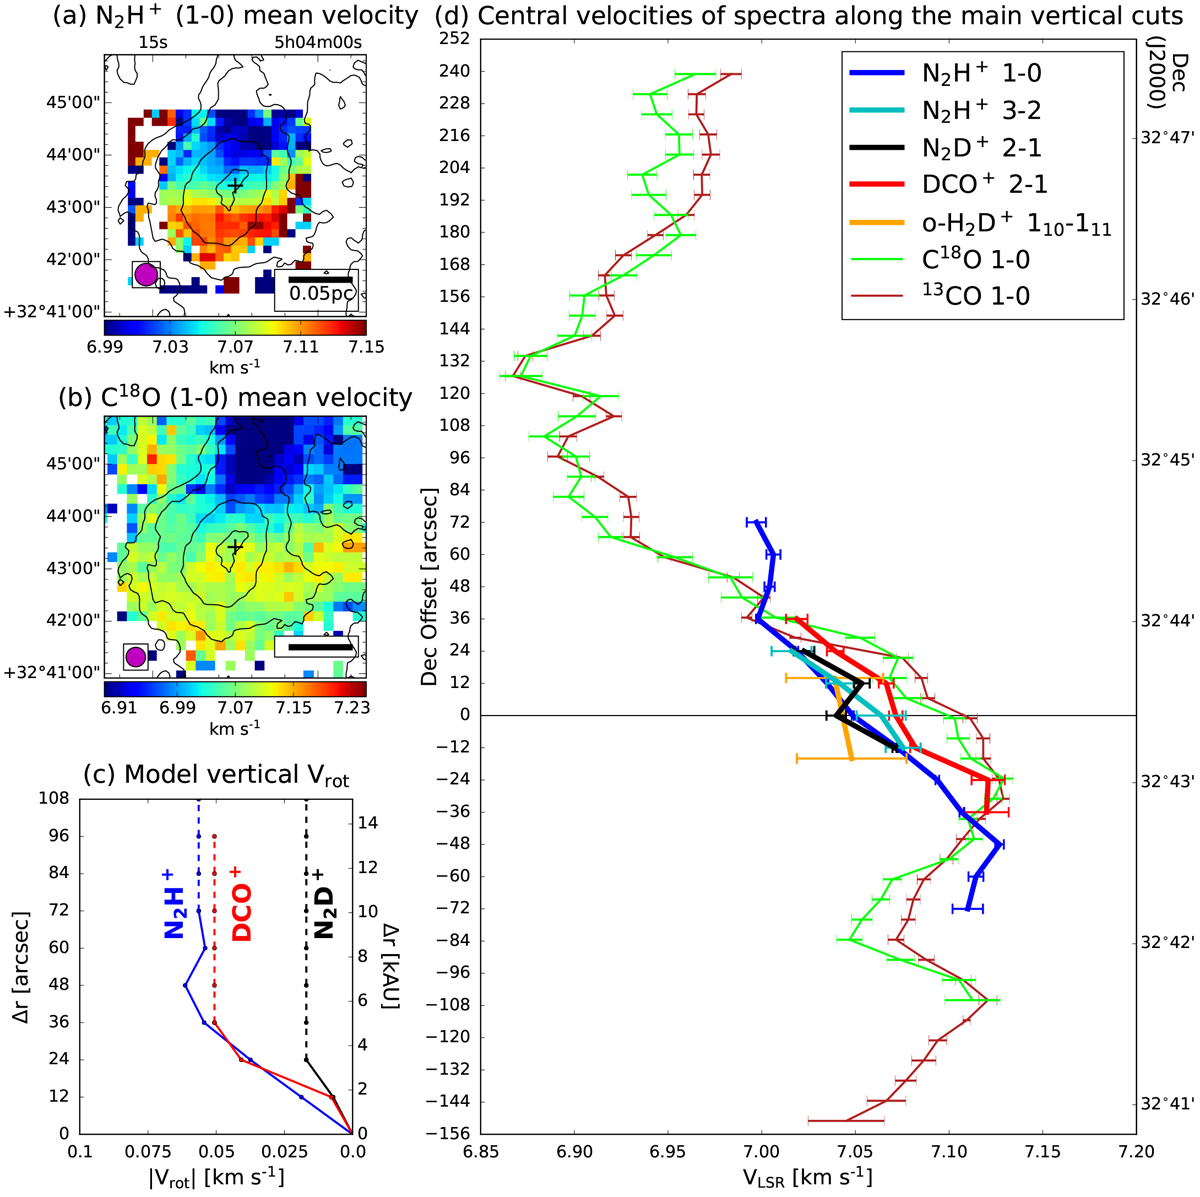
Velocity structure. Mean velocity maps of (a) the F1F = 2,3–1,2 component of N2H+ J = 1–0 and (b) C18O J = 1–0 calculated within VLSR = [6.75 km s−1, 7.50 km s−1] and [6.0 km s−1, 7.5 km s−1], respectively. Contours from the 850 μm image are overlaid. The rest of the symbols in the panels a and b have the same meaning as in Fig. 2. (c) Model vertical rotation velocities, Vrot, against radius, Δr, adopted in the radiative transfer model. (d) Central velocities and their error bars of the spectra along the main vertical cuts. Two y-axes are vertical offsets to the center and declination, respectively.
Current usage metrics show cumulative count of Article Views (full-text article views including HTML views, PDF and ePub downloads, according to the available data) and Abstracts Views on Vision4Press platform.
Data correspond to usage on the plateform after 2015. The current usage metrics is available 48-96 hours after online publication and is updated daily on week days.
Initial download of the metrics may take a while.