Fig. 3
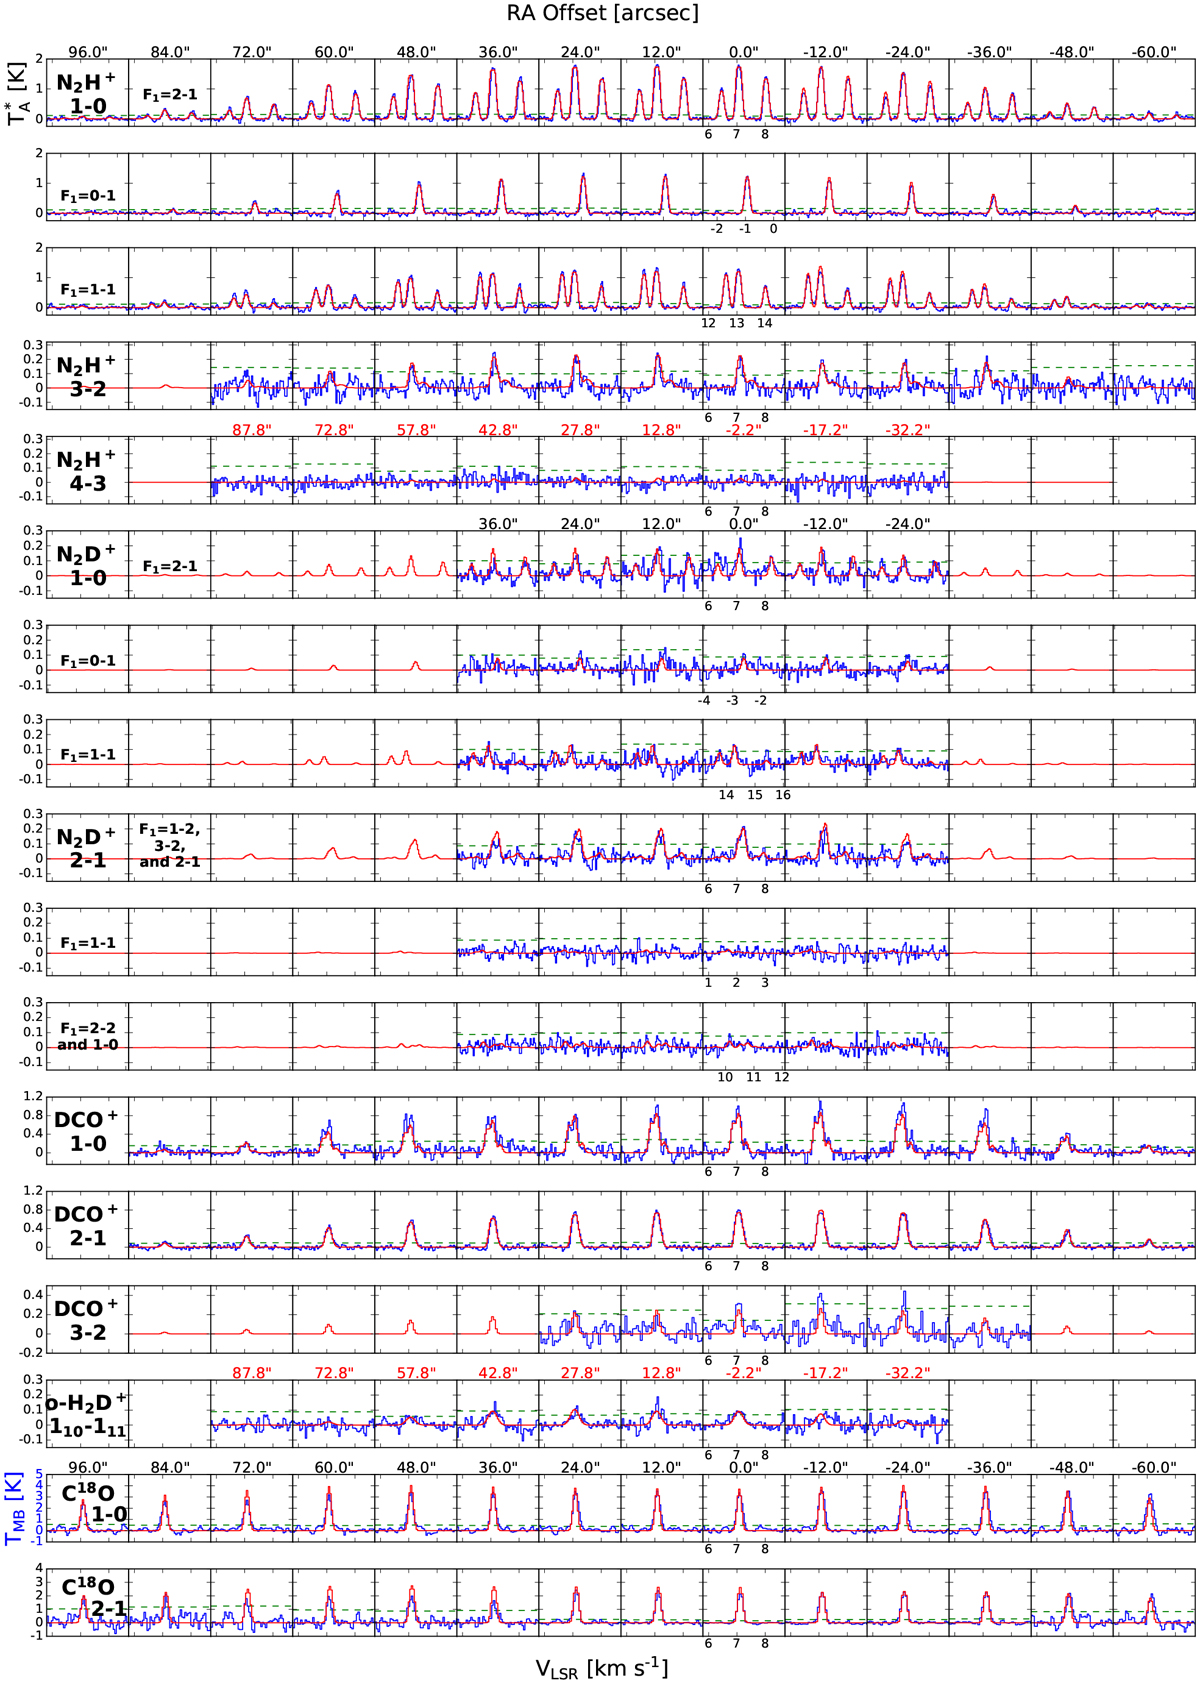
Spectral observations along the main horizontal cuts at ΔDec = −12′′ (IRAM/GBT) or −16′′ (JCMT) compared to our best-fit radiative transfer model. The blue spectra show the observational data, and the red spectra show the models. Each column corresponds to different horizontal offsets from the center of L 1512 according to Fig. 1. Each row shows a spectral line, except that the N2 H+ (1–0), N2D+ (1–0) and (2–1) lines are split into three rows corresponding to their different F1 -transition groups. For C18O (2–1), our data are supplemented with OTF spectra from previous works at large offsets. The green dashed lines indicate the three σ noise level.
Current usage metrics show cumulative count of Article Views (full-text article views including HTML views, PDF and ePub downloads, according to the available data) and Abstracts Views on Vision4Press platform.
Data correspond to usage on the plateform after 2015. The current usage metrics is available 48-96 hours after online publication and is updated daily on week days.
Initial download of the metrics may take a while.