Fig. 1
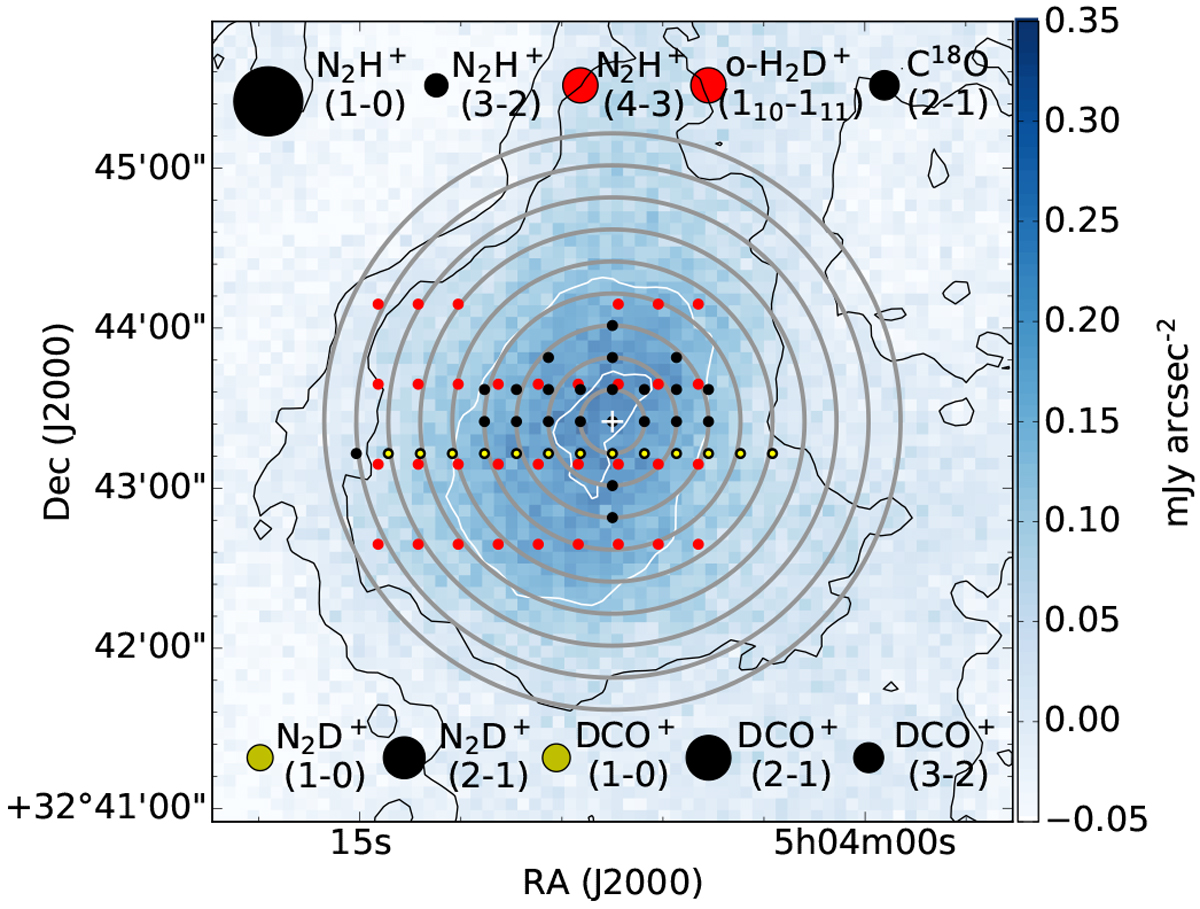
Multipointing grids and onion-shell model overlaid with the SCUBA-II 850 μm map. The black and yellow dots in a (ΔRA, ΔDec) = (12′′, 12′′)-spacing grid show the pointings of IRAM 30-m and GBT observations, respectively. The red dots in a (ΔRA, ΔDec) = (15′′, 30′′)-spacing grid show those of JCMT HARP observations. The circles at top and bottom indicate the beam sizes of each spectral observations. The gray concentric circles with center of L1512 represent the onion-shell model with shell widths of 12′′. The 850 μm map is shown in blue-scale, and its white and black contours have the same levels as in Fig. 2g.
Current usage metrics show cumulative count of Article Views (full-text article views including HTML views, PDF and ePub downloads, according to the available data) and Abstracts Views on Vision4Press platform.
Data correspond to usage on the plateform after 2015. The current usage metrics is available 48-96 hours after online publication and is updated daily on week days.
Initial download of the metrics may take a while.