Fig. 9
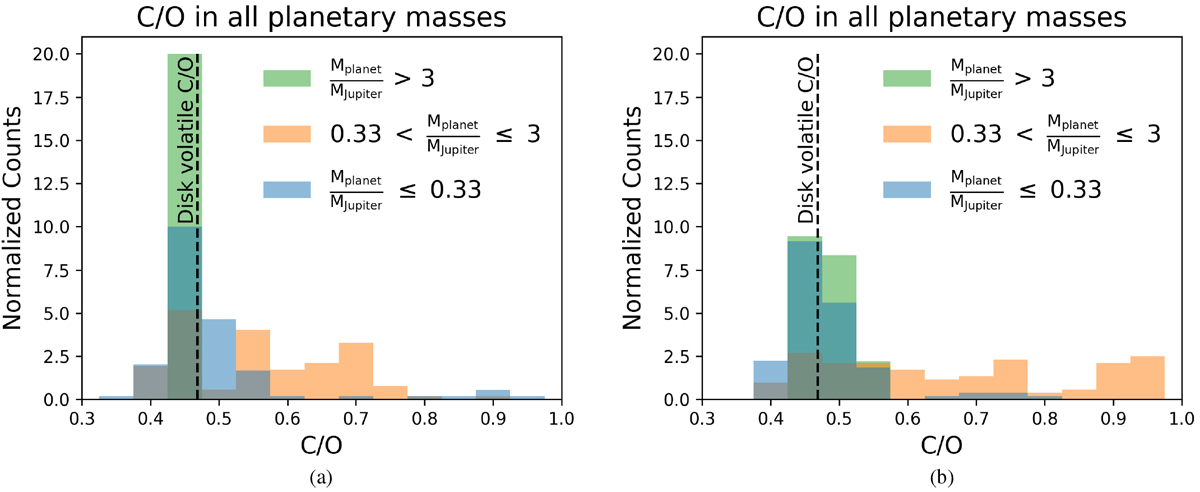
Histogram of C/O for different planetary masses throughout the history of planet formation for each synthetic planet for the 2D accretion model (a) and 1D accretion model (b). Each histogram is normalized so that the integral is equal to unity. Shown is the C/O for all the volatiles (gas and ice) in the disk for comparison (dashed line). For the high-mass planets, the majority have exactly the same C/O as the disk.
Current usage metrics show cumulative count of Article Views (full-text article views including HTML views, PDF and ePub downloads, according to the available data) and Abstracts Views on Vision4Press platform.
Data correspond to usage on the plateform after 2015. The current usage metrics is available 48-96 hours after online publication and is updated daily on week days.
Initial download of the metrics may take a while.