Fig. 7
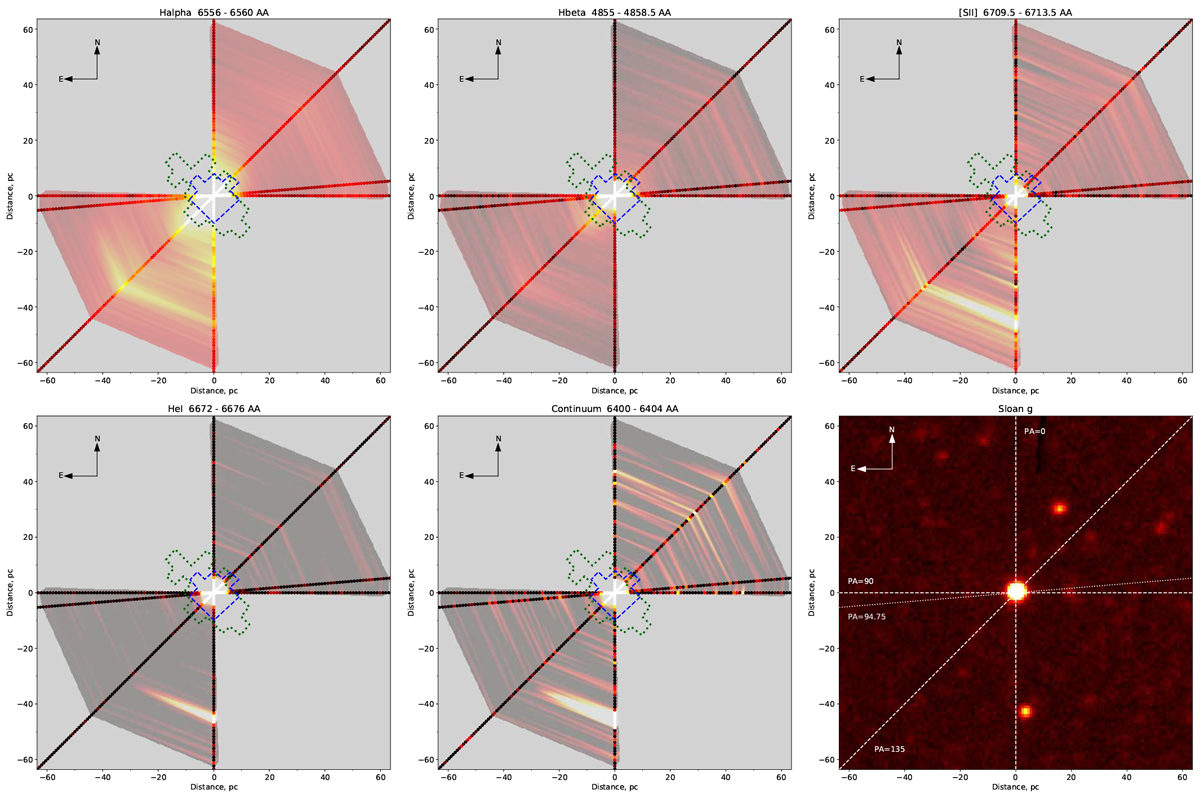
Spatial structure of the Hα (top left), Hβ (top middle), [S II] (top right), He I (bottom left) and a continuum at 6400 Å (bottom middle) emission in the ±60 × 60 pc region centered on GR 290 according to the spatial tracings in four slit orientations. Every dot corresponds to a one-pixel (1.06 pc) step along the slit, with black-to-white scale defined as in Figs. 5 and 6 as 6% of a peak line intensity (16% for [S II]). For visual clarity, the rough linear interpolation between these points is also shown in a semi-transparent overlay inside NW–SE sectors where our coverage is dense enough. While it does not necessarily reflect the “true” intensity distribution between the slits and especially in the NE–SW direction where we lack data, it still perfectly depicts the significant asymmetry of the nebula along the NW–SE direction. Blue dashed and green dotted lines mark the extent of the nebula reported by Fabrika et al. (2005) in narrow Hβ intensity and velocity gradient, respectively. Also, for ease of comparison, direct image of the region in Sloan g filter with the same scale and orientation is shown in bottom right panel, which is a subset of Fig. 3.
Current usage metrics show cumulative count of Article Views (full-text article views including HTML views, PDF and ePub downloads, according to the available data) and Abstracts Views on Vision4Press platform.
Data correspond to usage on the plateform after 2015. The current usage metrics is available 48-96 hours after online publication and is updated daily on week days.
Initial download of the metrics may take a while.