Fig. 5
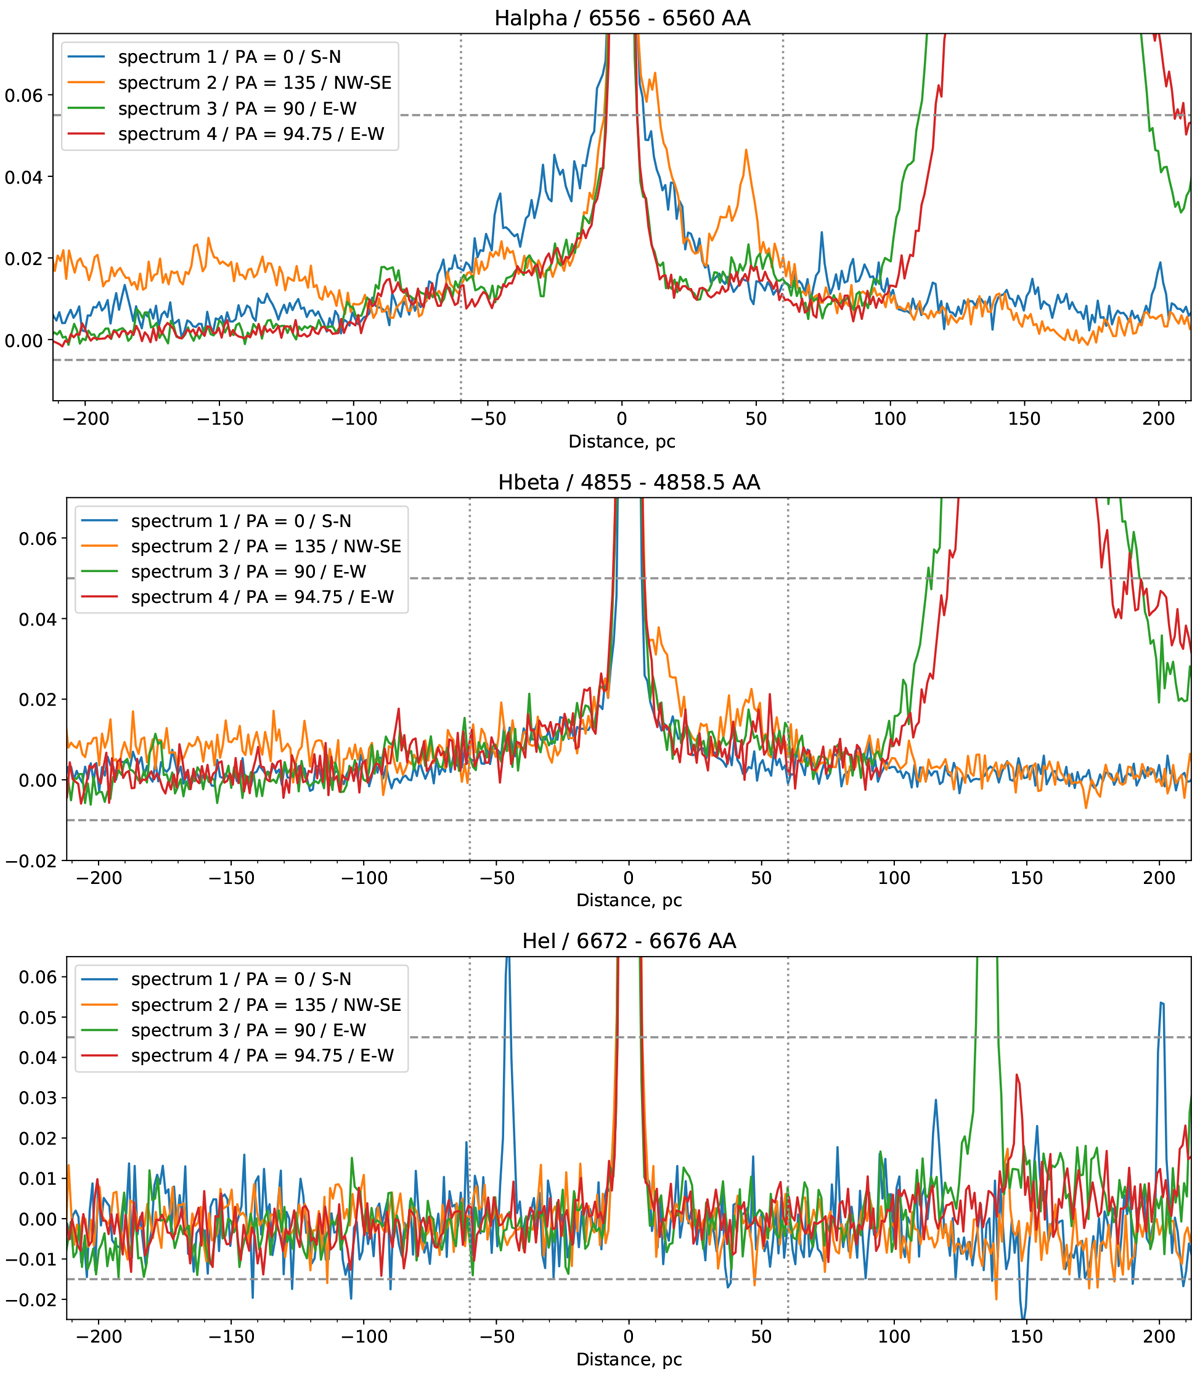
Tracings of the intensity of Hα, Hβ, and He I along the slit allowing a comparison of the spatial distribution of these emissions in the vicinity of GR 290. The horizontal axis is the linear distance from GR 290 in parsecs. The vertical axis gives the scaledintensity, with a scaling such that the maximum intensity of each line is set to unity. The horizontal lines indicate the intensity interval (6% of a peak intensity) used to define the black-to-white scale shown in Figs. 3 (right) and 7. The vertical lines enclose the ±60 pc subregion shown in Fig. 7. Each panel is labeled with the wavelength interval on the observed spectrum before correcting for the M 33 radial velocity. The same tracings for [N II] and [S II] are shown below in Fig. 6.
Current usage metrics show cumulative count of Article Views (full-text article views including HTML views, PDF and ePub downloads, according to the available data) and Abstracts Views on Vision4Press platform.
Data correspond to usage on the plateform after 2015. The current usage metrics is available 48-96 hours after online publication and is updated daily on week days.
Initial download of the metrics may take a while.