Fig. 4
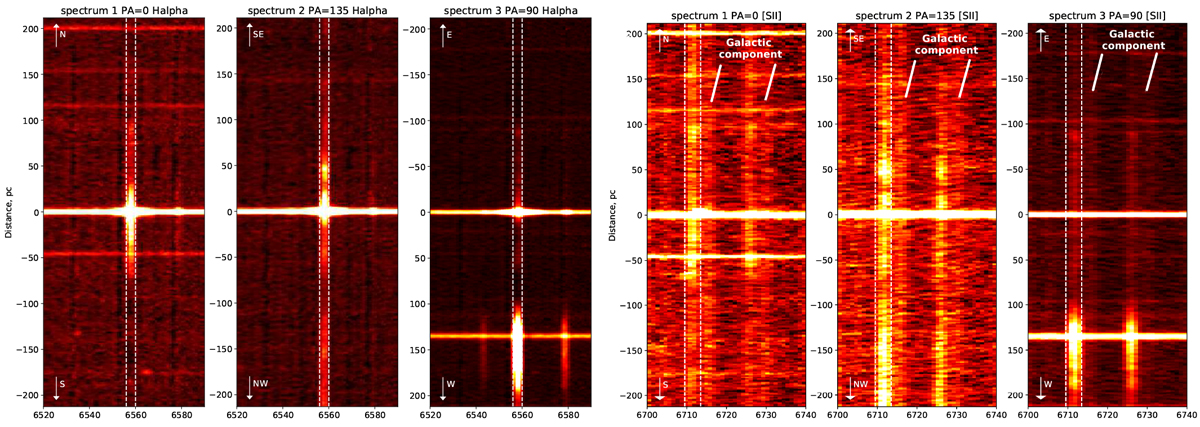
Spatial distribution (vertical axis, given in pc) of the emission along the slit in the wavelength intervals (horizontal axis) 6520–6590 Å (left panels) and 6700–6740 Å (right panels), for three slit orientations. The vertical dimension is the same as that of the dimensions in the identification chart shown in Fig. 3. Arrows at the top and bottom of each image indicate the orientation. The aperture size that was used for the extraction of Hα and [S II] along each slit is indicated with the white dashed lines. Right panels: the Galactic [S II] emission is also visible to the right of the M 33 emission. Dark faint traces along the vertical axis are residual marks of subtraction of night sky lines from the images, done mostly for cosmetic and presentational purposes.
Current usage metrics show cumulative count of Article Views (full-text article views including HTML views, PDF and ePub downloads, according to the available data) and Abstracts Views on Vision4Press platform.
Data correspond to usage on the plateform after 2015. The current usage metrics is available 48-96 hours after online publication and is updated daily on week days.
Initial download of the metrics may take a while.