Fig. 3
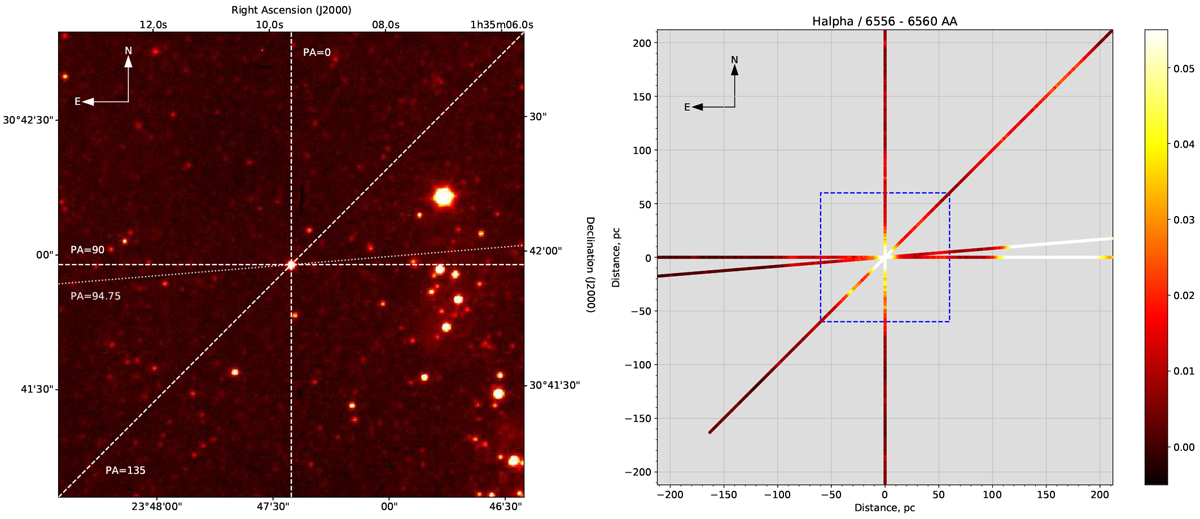
Left: identification chart for a 100′′ wide region around GR 290 in the Sloan g filter image illustrating the slit positions used during the 2018 observations (dashed lines), as well as during the 2016 (dotted line). The axes are given in RA and Dec and the position angle of each slit is listed. The stellar association OB 89 is located to the right (West) of GR 290. Right: spatial distribution of the Hα intensity along each of the three slits. The orientation and scale of the image is the same asin left panel, but here the axes are given in linear distance (pc) from GR 290, which lies at the center of the coordinate system. Distance is computed assuming a 1.06 pc pix−1 scale along the slit. The strongest emission is color coded in white. Extended emissionis evident south and east of GR 290. The dotted square defines the ±60 pc subregion that we analyze in detail.
Current usage metrics show cumulative count of Article Views (full-text article views including HTML views, PDF and ePub downloads, according to the available data) and Abstracts Views on Vision4Press platform.
Data correspond to usage on the plateform after 2015. The current usage metrics is available 48-96 hours after online publication and is updated daily on week days.
Initial download of the metrics may take a while.