Fig. 2
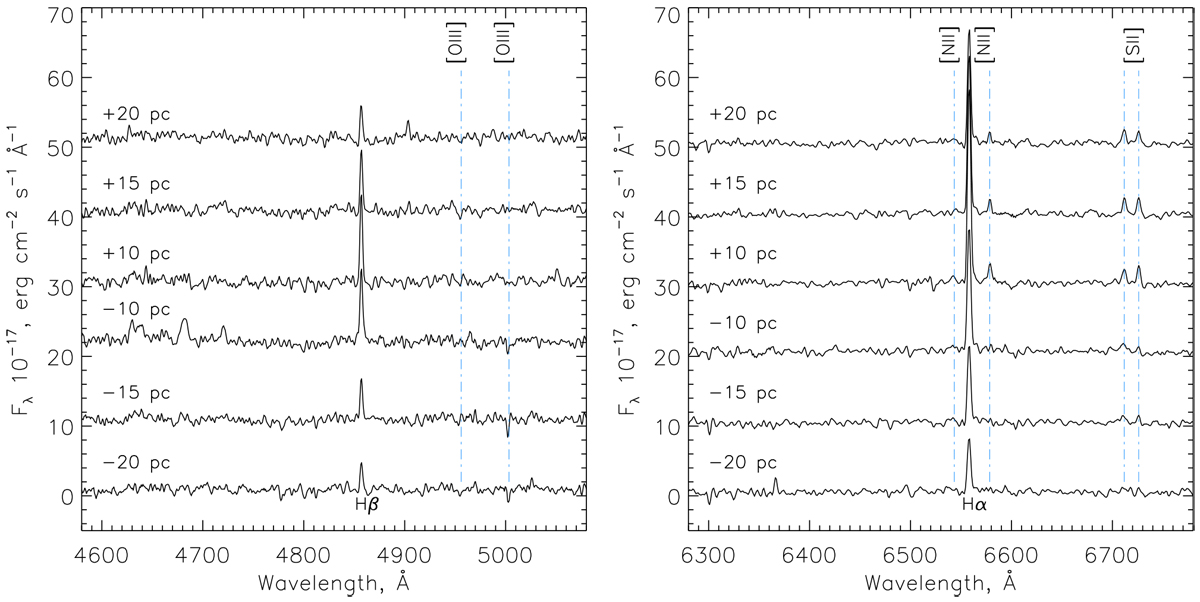
Emission spectra of a nebula in the regions extracted from a two-dimensional spectral image, corresponding to slit PA = 135° (orientated southeast-northwest; see Table 1 and Fig. 3) at different distances from the star. For clarity, the spectra are shifted vertically, and the original baseline of every spectrum is equal to zero. Spectra are extracted inapertures of 5 pixels in width, corresponding to a spatial resolution of 5.3 pc. The spectra are centered on Hβ (left panel) and Hα (right panel); no other spectral region contains any detectable nebular line.
Current usage metrics show cumulative count of Article Views (full-text article views including HTML views, PDF and ePub downloads, according to the available data) and Abstracts Views on Vision4Press platform.
Data correspond to usage on the plateform after 2015. The current usage metrics is available 48-96 hours after online publication and is updated daily on week days.
Initial download of the metrics may take a while.