Fig. 5.
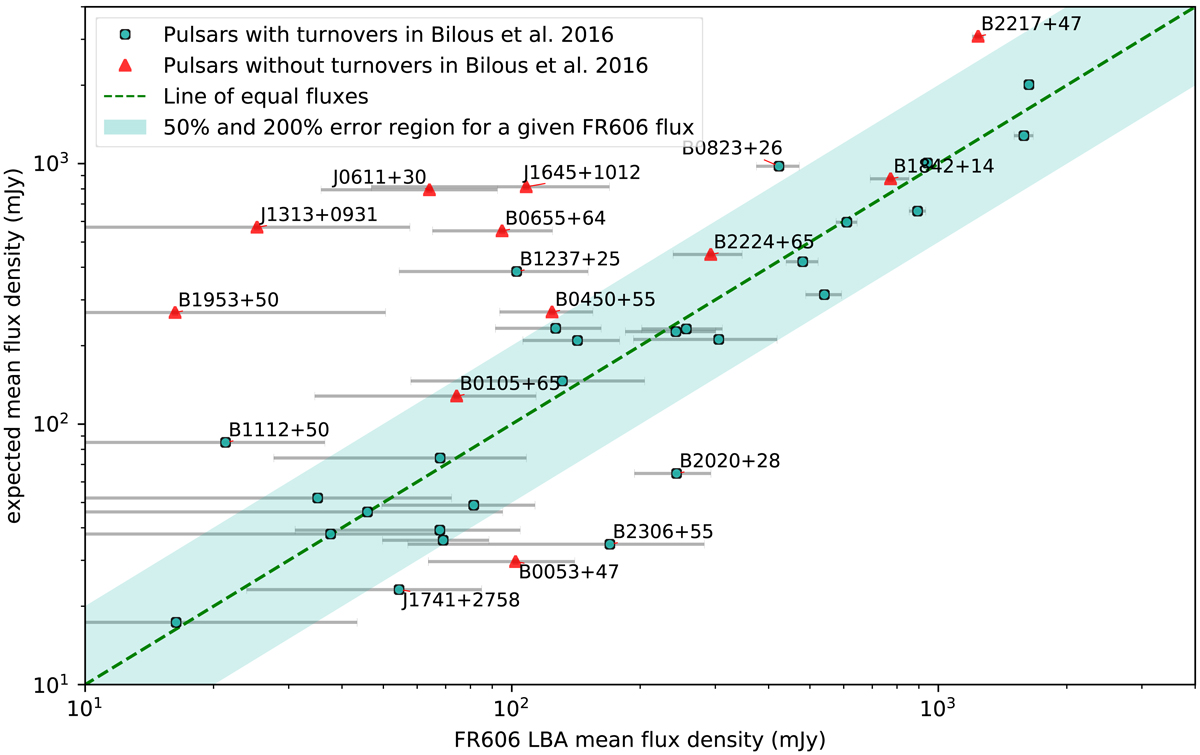
Comparison of the mean flux densities reported in this paper with those obtained from the fitted spectral indices in Bilous et al. (2016). Blue dots: pulsars fitted with at least one turnover in their spectrum. Red triangles: pulsars fitted with a single spectral index. The line of equal flux values is shown by a green dashed line. In order to maintain symmetry between the two axes, we take a range from 50 to 200% of the equal flux value (green area) for the systematic error.
Current usage metrics show cumulative count of Article Views (full-text article views including HTML views, PDF and ePub downloads, according to the available data) and Abstracts Views on Vision4Press platform.
Data correspond to usage on the plateform after 2015. The current usage metrics is available 48-96 hours after online publication and is updated daily on week days.
Initial download of the metrics may take a while.