Fig. 2.
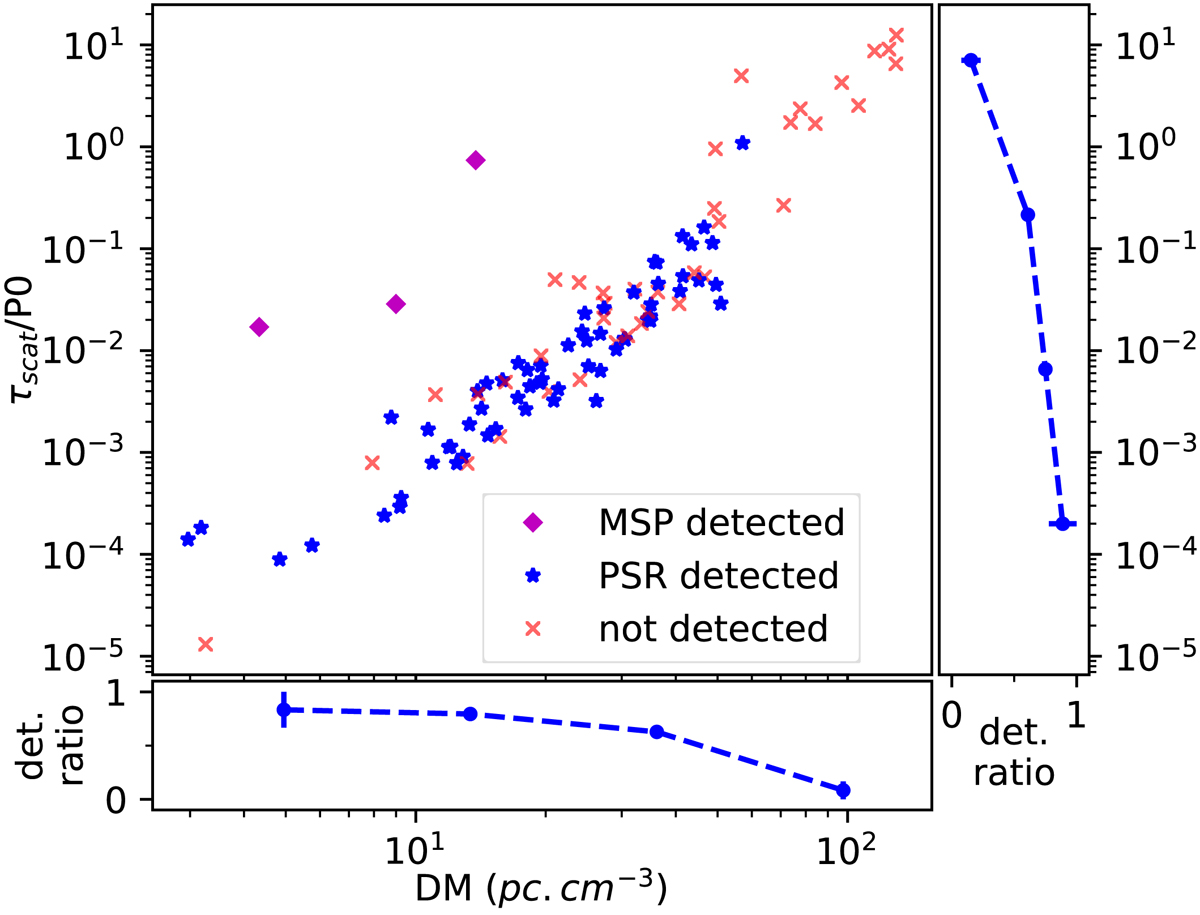
Scattering time in units of the pulsar period vs. the dispersion measure for the pulsars of our sample (centre plot, double-logarithmic axes). Detected slow pulsars are shown as blue stars, millisecond pulsars as magenta diamonds, and non-detections as red crosses. Right and bottom panels: (with semi-logarithmic axes) fraction of detected pulsars for each axis of the central plot.
Current usage metrics show cumulative count of Article Views (full-text article views including HTML views, PDF and ePub downloads, according to the available data) and Abstracts Views on Vision4Press platform.
Data correspond to usage on the plateform after 2015. The current usage metrics is available 48-96 hours after online publication and is updated daily on week days.
Initial download of the metrics may take a while.