Fig. 1.
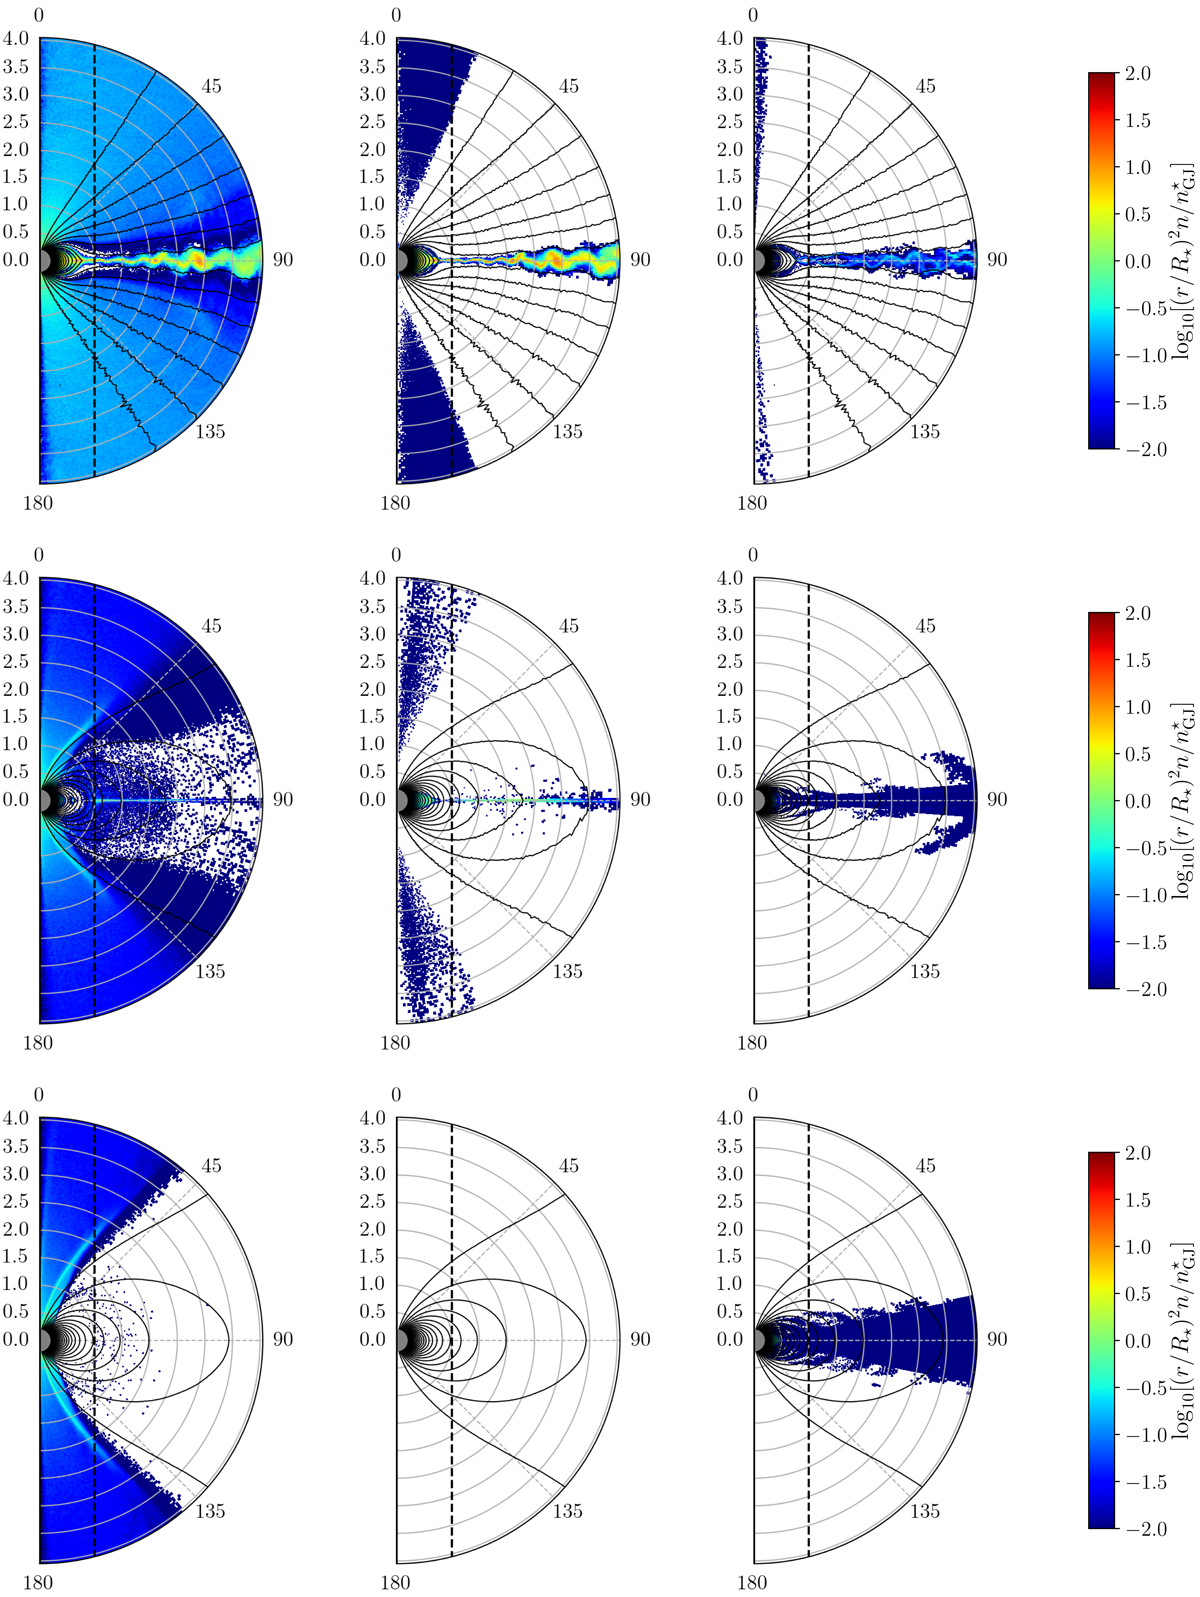
Density maps for electrons, positrons, and protons (left to right), for fpp = 0.01, fpp = 0.05 and fpp = 0.1 (top to bottom), as a function of r/RLC and θ, for t = 5P. The densities are normalised by ![]() , where
, where ![]() is the polar GJ number density. Solid black lines are the magnetic field lines. The dashed black line indicates the distance from the rotation axis r sin θ = RLC and the grey semi-disc represents the neutron star. The densities are in log scale in order to enhance the contrast.
is the polar GJ number density. Solid black lines are the magnetic field lines. The dashed black line indicates the distance from the rotation axis r sin θ = RLC and the grey semi-disc represents the neutron star. The densities are in log scale in order to enhance the contrast.
Current usage metrics show cumulative count of Article Views (full-text article views including HTML views, PDF and ePub downloads, according to the available data) and Abstracts Views on Vision4Press platform.
Data correspond to usage on the plateform after 2015. The current usage metrics is available 48-96 hours after online publication and is updated daily on week days.
Initial download of the metrics may take a while.