Fig. 7.
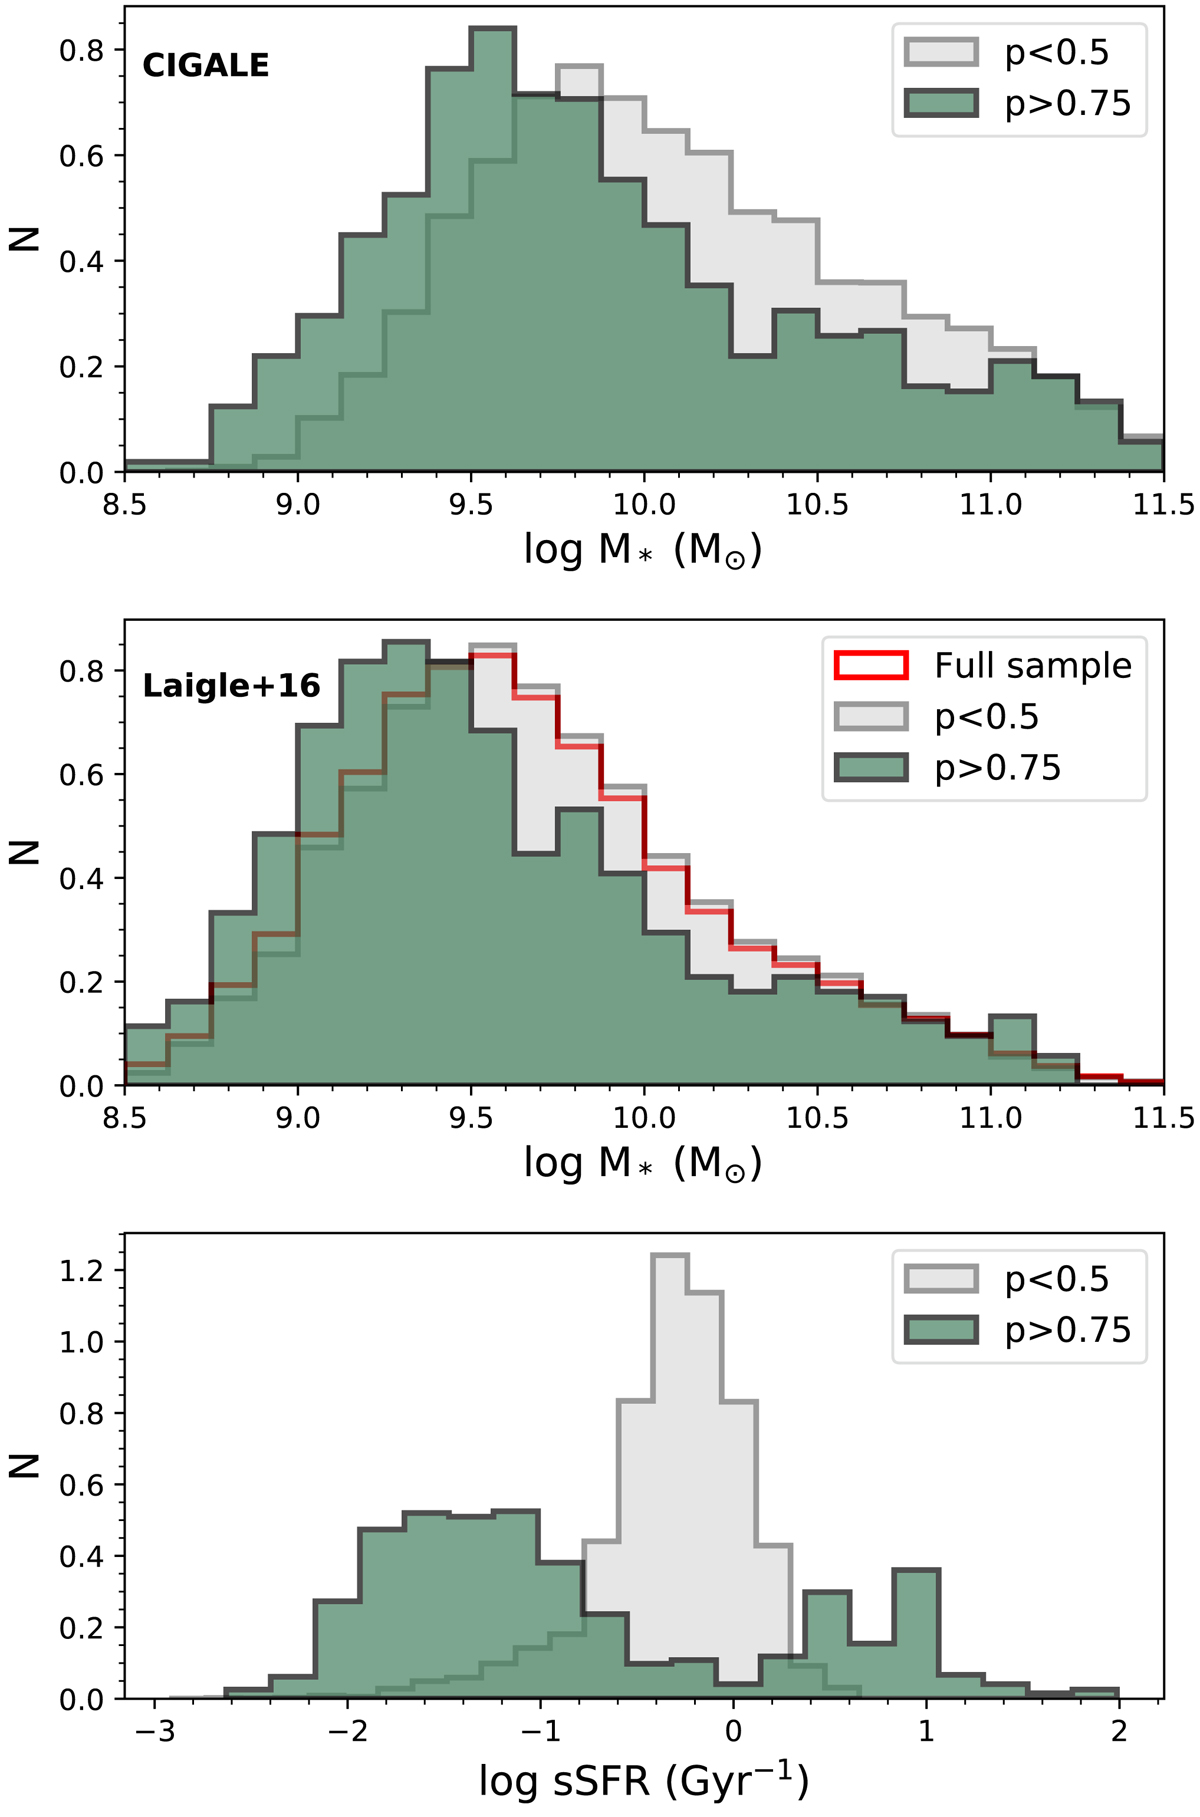
Top panel: comparison of the stellar mass distribution obtained with CIGALE for the sample of galaxies with ![]() (green) and galaxies with
(green) and galaxies with ![]() (gray). Middle panel: comparison of the stellar mass distribution obtained by Laigle et al. (2016) for the sample of galaxies with
(gray). Middle panel: comparison of the stellar mass distribution obtained by Laigle et al. (2016) for the sample of galaxies with ![]() (green) and galaxies with
(green) and galaxies with ![]() (gray). Bottom panel: comparison of the sSFR distribution for the sample of galaxies with
(gray). Bottom panel: comparison of the sSFR distribution for the sample of galaxies with ![]() (green) and galaxies with
(green) and galaxies with ![]() (gray).
(gray).
Current usage metrics show cumulative count of Article Views (full-text article views including HTML views, PDF and ePub downloads, according to the available data) and Abstracts Views on Vision4Press platform.
Data correspond to usage on the plateform after 2015. The current usage metrics is available 48-96 hours after online publication and is updated daily on week days.
Initial download of the metrics may take a while.